

Fragile X protein controls neural stem cell proliferation in the Drosophila brain
- PMID: 20504994
- PMCID: PMC2901145
- DOI: 10.1093/hmg/ddq213
Fragile X protein controls neural stem cell proliferation in the Drosophila brain
Abstract
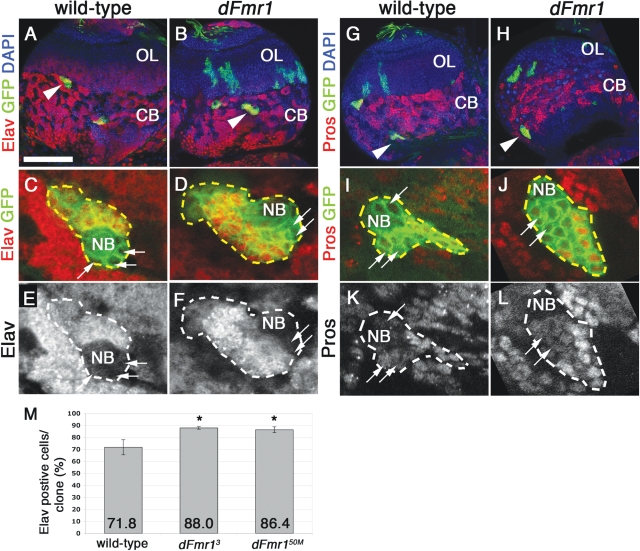
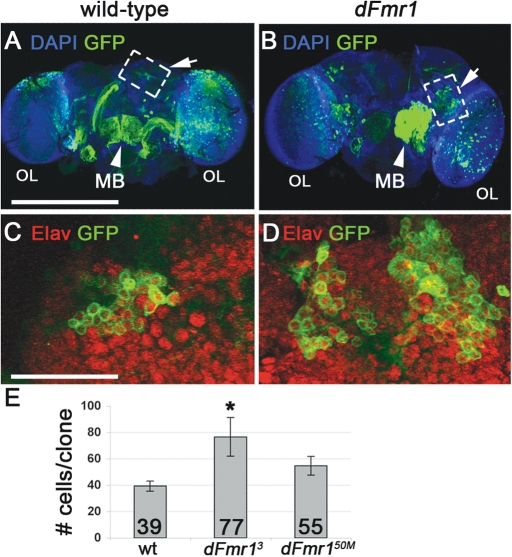
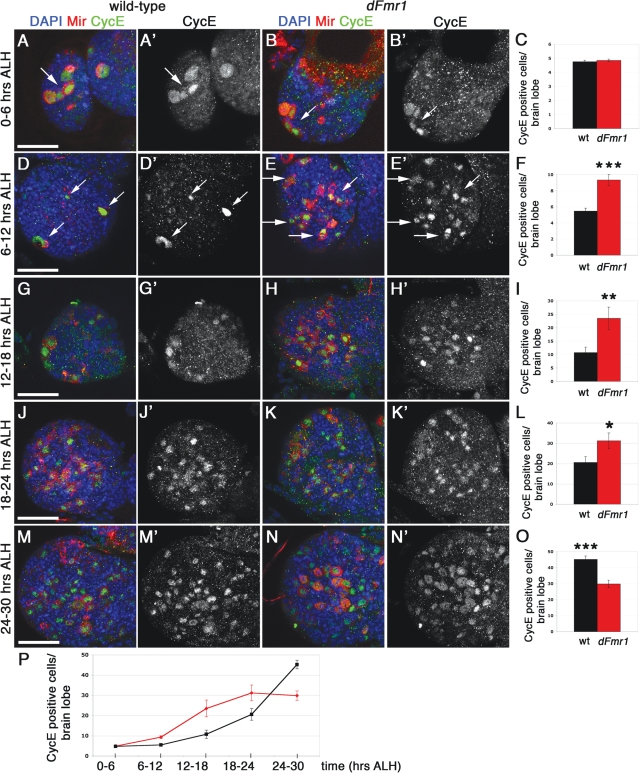
Fragile X syndrome (FXS) is the most common form of inherited mental retardation and is caused by the loss of function for Fragile X protein (FMRP), an RNA-binding protein thought to regulate synaptic plasticity by controlling the localization and translation of specific mRNAs. We have recently shown that FMRP is required to control the proliferation of the germline in Drosophila. To determine whether FMRP is also required for proliferation during brain development, we examined the distribution of cell cycle markers in dFmr1 brains compared with wild-type throughout larval development. Our results indicate that the loss of dFmr1 leads to a significant increase in the number of mitotic neuroblasts (NB) and BrdU incorporation in the brain, consistent with the notion that FMRP controls proliferation during neurogenesis. Developmental studies suggest that FMRP also inhibits neuroblast exit from quiescence in early larval brains, as indicated by misexpression of Cyclin E. Live imaging experiments indicate that by the third instar larval stage, the length of the cell cycle is unaffected, although more cells are found in S and G2/M in dFmr1 brains compared with wild-type. To determine the role of FMRP in neuroblast division and differentiation, we used Mosaic Analysis with a Repressible Marker (MARCM) approaches in the developing larval brain and found that single dFmr1 NB generate significantly more neurons than controls. Our results demonstrate that FMRP is required during brain development to control the exit from quiescence and proliferative capacity of NB as well as neuron production, which may provide insights into the autistic component of FXS.
Figures


Similar articles
-
Fragile X Protein is required for inhibition of insulin signaling and regulates glial-dependent neuroblast reactivation in the developing brain.Brain Res. 2012 Jun 26;1462:151-61. doi: 10.1016/j.brainres.2012.03.042. Epub 2012 Mar 27. Brain Res. 2012. PMID: 22513101
-
Drosophila FMRP participates in the DNA damage response by regulating G2/M cell cycle checkpoint and apoptosis.Hum Mol Genet. 2012 Nov 1;21(21):4655-68. doi: 10.1093/hmg/dds307. Epub 2012 Jul 26. Hum Mol Genet. 2012. PMID: 22843500
-
Fragile X mental retardation protein modulates the fate of germline stem cells in Drosophila.Hum Mol Genet. 2007 Aug 1;16(15):1814-20. doi: 10.1093/hmg/ddm129. Epub 2007 May 21. Hum Mol Genet. 2007. PMID: 17519221
-
dFmr1 Plays Roles in Small RNA Pathways of Drosophila melanogaster.Int J Mol Sci. 2017 May 16;18(5):1066. doi: 10.3390/ijms18051066. Int J Mol Sci. 2017. PMID: 28509881 Free PMC article. Review.
-
Molecular and cellular aspects of mental retardation in the Fragile X syndrome: from gene mutation/s to spine dysmorphogenesis.Adv Exp Med Biol. 2012;970:517-51. doi: 10.1007/978-3-7091-0932-8_23. Adv Exp Med Biol. 2012. PMID: 22351071 Review.
Cited by
-
The RNA-binding proteins FMR1, rasputin and caprin act together with the UBA protein lingerer to restrict tissue growth in Drosophila melanogaster.PLoS Genet. 2013;9(7):e1003598. doi: 10.1371/journal.pgen.1003598. Epub 2013 Jul 11. PLoS Genet. 2013. PMID: 23874212 Free PMC article.
-
Functional assessment of the "two-hit" model for neurodevelopmental defects in Drosophila and X. laevis.PLoS Genet. 2021 Apr 5;17(4):e1009112. doi: 10.1371/journal.pgen.1009112. eCollection 2021 Apr. PLoS Genet. 2021. PMID: 33819264 Free PMC article.
-
Cytoplasmic division cycles without the nucleus and mitotic CDK/cyclin complexes.Cell. 2023 Oct 12;186(21):4694-4709.e16. doi: 10.1016/j.cell.2023.09.010. Cell. 2023. PMID: 37832525 Free PMC article.
-
Molecular mechanisms regulating the defects in fragile X syndrome neurons derived from human pluripotent stem cells.Stem Cell Reports. 2015 Jan 13;4(1):37-46. doi: 10.1016/j.stemcr.2014.10.015. Epub 2014 Dec 4. Stem Cell Reports. 2015. PMID: 25483109 Free PMC article.
-
FMRP-dependent production of large dosage-sensitive proteins is highly conserved.Genetics. 2022 Jul 30;221(4):iyac094. doi: 10.1093/genetics/iyac094. Genetics. 2022. PMID: 35731217 Free PMC article.
References
-
- Penagarikano O., Mulle J.G., Warren S.T. The pathophysiology of fragile X syndrome. Annu. Rev. Genomics Hum. Genet. 2007;8:109–129. doi:10.1146/annurev.genom.8.080706.092249. - DOI - PubMed
-
- Zhang Y.Q., Bailey A.M., Matthies H.J., Renden R.B., Smith M.A., Speese S.D., Rubin G.M., Broadie K. Drosophila fragile X-related gene regulates the MAP1B homolog Futsch to control synaptic structure and function. Cell. 2001;107:591–603. doi:10.1016/S0092-8674(01)00589-X. - DOI - PubMed
-
- Reeve S.P., Bassetto L., Genova G.K., Kleyner Y., Leyssen M., Jackson F.R., Hassan B.A. The Drosophila fragile X mental retardation protein controls actin dynamics by directly regulating profilin in the brain. Curr. Biol. 2005;15:1156–1163. doi:10.1016/j.cub.2005.05.050. - DOI - PubMed
-
- Schenck A., Bardoni B., Langmann C., Harden N., Mandel J.L., Giangrande A. CYFIP/Sra-1 controls neuronal connectivity in Drosophila and links the Rac1 GTPase pathway to the fragile X protein. Neuron. 2003;38:887–898. doi:10.1016/S0896-6273(03)00354-4. - DOI - PubMed
-
- Zalfa F., Eleuteri B., Dickson K.S., Mercaldo V., De Rubeis S., di Penta A., Tabolacci E., Chiurazzi P., Neri G., Grant S.G., et al. A new function for the fragile X mental retardation protein in regulation of PSD-95 mRNA stability. Nat. Neurosci. 2007;10:578–587. doi:10.1038/nn1893. - DOI - PMC - PubMed
Publication types
MeSH terms
Substances
Grants and funding
LinkOut - more resources
Full Text Sources
Medical
Molecular Biology Databases
