Comparative Study
. 2010 Jul;256(1):176-83.
doi: 10.1148/radiol.10091147. Epub 2010 May 26.

Prostate cancer managed with active surveillance: role of anatomic MR imaging and MR spectroscopic imaging

Affiliations
Comparative Study

Prostate cancer managed with active surveillance: role of anatomic MR imaging and MR spectroscopic imaging

Vincent Fradet et al. Radiology. 2010 Jul.

Abstract

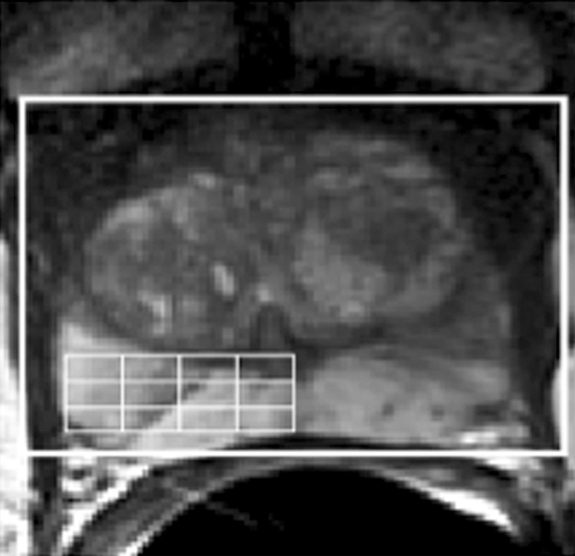
Purpose: To determine the role that magnetic resonance (MR) imaging and MR spectroscopic imaging findings obtained at the time of diagnosis play in the progression of disease in patients whose prostate cancer is being managed with active surveillance and to compare the role of these findings with the role of transrectal ultrasonography (US) findings.

Materials and methods: The institutional review board approved this HIPAA-compliant retrospective study, and informed consent was obtained from all patients whose records were to be entered into the research database. All patients who had prostate cancer managed with active surveillance and who had undergone both MR imaging and MR spectroscopic imaging of the prostate and transrectal US at time of diagnosis were identified. Two urologists blinded to the clinical outcome in these patients independently reviewed and dichotomized the MR imaging report and the MR spectroscopic imaging report as normal or suggestive of malignancy. One experienced urologist performed all US examinations that were then dichotomized similarly. Uni- and multivariate (with use of standard clinical variables) Cox models were fitted to assess time to cancer progression, defined as Gleason score upgrading, prostate-specific antigen velocity of more than 0.75 (microg x L(-1))/y, or initiation of treatment more than 6 months after diagnosis.

Results: The final cohort included 114 patients with a median follow-up of 59 months. Patients with a lesion that was suggestive of cancer at MR imaging had a greater risk of the Gleason score being upgraded at subsequent biopsy (hazard ratio, 4.0; 95% confidence interval: 1.1, 14.9) than did patients without such a lesion. Neither MR spectroscopic imaging nor transrectal US could be used to predict cancer progression.

Conclusion: Abnormal prostate MR imaging results suggestive of cancer may confer an increased risk of Gleason score upgrade at subsequent biopsy. Although expensive, prostate MR imaging may help in counseling potential candidates about active surveillance.


Conflict of interest statement

Authors stated no financial relationship to disclose.

Figures

Figure 1:
Figure 1:
Flowchart shows Gleason score upgrade findings at repeated prostate biopsy.
Figure 2a:
Figure 2a:
(a) Reception profile-corrected transverse T2-weighted image obtained from a volume MR imaging and MR spectroscopic imaging data set in a patient with a current PSA level of 5.93 μg/L and a small amount of biopsy-proved cancer (2-mm lesion, Gleason score of 3 + 3) in the right midgland toward the apex. At T2-weighted MR imaging, there were no clear regions of hypointensity indicative of cancer in the left midgland and apex. (b, c) The selected volume for spectroscopy (white box) and a portion of the 16 × 8 × 8 spectral phase encode grid (fine lines) was overlaid on the transverse T2-weighted image (b), with the corresponding 0.3-cm3 proton spectral array (c). There were high levels of citrate and polyamines and low levels of choline throughout the left midgland and apex, indicating healthy prostate metabolism. Across the 48 months since baseline MR imaging and MR spectroscopic imaging, the patient did not have a clinically important increase in PSA level.
Figure 2b:
Figure 2b:
(a) Reception profile-corrected transverse T2-weighted image obtained from a volume MR imaging and MR spectroscopic imaging data set in a patient with a current PSA level of 5.93 μg/L and a small amount of biopsy-proved cancer (2-mm lesion, Gleason score of 3 + 3) in the right midgland toward the apex. At T2-weighted MR imaging, there were no clear regions of hypointensity indicative of cancer in the left midgland and apex. (b, c) The selected volume for spectroscopy (white box) and a portion of the 16 × 8 × 8 spectral phase encode grid (fine lines) was overlaid on the transverse T2-weighted image (b), with the corresponding 0.3-cm3 proton spectral array (c). There were high levels of citrate and polyamines and low levels of choline throughout the left midgland and apex, indicating healthy prostate metabolism. Across the 48 months since baseline MR imaging and MR spectroscopic imaging, the patient did not have a clinically important increase in PSA level.
Figure 2c:
Figure 2c:
(a) Reception profile-corrected transverse T2-weighted image obtained from a volume MR imaging and MR spectroscopic imaging data set in a patient with a current PSA level of 5.93 μg/L and a small amount of biopsy-proved cancer (2-mm lesion, Gleason score of 3 + 3) in the right midgland toward the apex. At T2-weighted MR imaging, there were no clear regions of hypointensity indicative of cancer in the left midgland and apex. (b, c) The selected volume for spectroscopy (white box) and a portion of the 16 × 8 × 8 spectral phase encode grid (fine lines) was overlaid on the transverse T2-weighted image (b), with the corresponding 0.3-cm3 proton spectral array (c). There were high levels of citrate and polyamines and low levels of choline throughout the left midgland and apex, indicating healthy prostate metabolism. Across the 48 months since baseline MR imaging and MR spectroscopic imaging, the patient did not have a clinically important increase in PSA level.
Figure 3a:
Figure 3a:
(a) Reception profile-corrected transverse T2-weighted image obtained from a volume MR imaging and MR spectroscopic imaging data set in a patient with a current PSA level of 5.60 μg/L and biopsy-proved cancer (12-mm lesion, Gleason score of 3 + 3) in the left base. The selected volume for spectroscopy (white box) and a portion of the 16 × 8 × 8 spectral phase encode grid (fine lines) was overlaid on the image. (b) At T2-weighted MR imaging, there was a region of hypointensity (arrows) in the left base. (c) The corresponding spectral array showed elevated choline and reduced citrate and polyamine levels (shaded area) in approximately the same region as the T2 hypointensity. Across the 60 months since baseline MR imaging and MR spectroscopic imaging, the patient had high PSA velocity (> 75 [μg L−1]/y); at follow-up biopsy, he had an increase in the amount of histologically proved disease (28-mm lesion, Gleason score of 3 + 3 in the left base; 1-mm lesion in the left midgland).
Figure 3b:
Figure 3b:
(a) Reception profile-corrected transverse T2-weighted image obtained from a volume MR imaging and MR spectroscopic imaging data set in a patient with a current PSA level of 5.60 μg/L and biopsy-proved cancer (12-mm lesion, Gleason score of 3 + 3) in the left base. The selected volume for spectroscopy (white box) and a portion of the 16 × 8 × 8 spectral phase encode grid (fine lines) was overlaid on the image. (b) At T2-weighted MR imaging, there was a region of hypointensity (arrows) in the left base. (c) The corresponding spectral array showed elevated choline and reduced citrate and polyamine levels (shaded area) in approximately the same region as the T2 hypointensity. Across the 60 months since baseline MR imaging and MR spectroscopic imaging, the patient had high PSA velocity (> 75 [μg L−1]/y); at follow-up biopsy, he had an increase in the amount of histologically proved disease (28-mm lesion, Gleason score of 3 + 3 in the left base; 1-mm lesion in the left midgland).
Figure 3c:
Figure 3c:
(a) Reception profile-corrected transverse T2-weighted image obtained from a volume MR imaging and MR spectroscopic imaging data set in a patient with a current PSA level of 5.60 μg/L and biopsy-proved cancer (12-mm lesion, Gleason score of 3 + 3) in the left base. The selected volume for spectroscopy (white box) and a portion of the 16 × 8 × 8 spectral phase encode grid (fine lines) was overlaid on the image. (b) At T2-weighted MR imaging, there was a region of hypointensity (arrows) in the left base. (c) The corresponding spectral array showed elevated choline and reduced citrate and polyamine levels (shaded area) in approximately the same region as the T2 hypointensity. Across the 60 months since baseline MR imaging and MR spectroscopic imaging, the patient had high PSA velocity (>75 [μg L−1]/y); at follow-up biopsy, he had an increase in the amount of histologically proved disease (28-mm lesion, Gleason score of 3 + 3 in the left base; 1-mm lesion in the left midgland).

References

    1. Cooperberg MR, Broering JM, Carroll PR. Risk assessment for prostate cancer metastasis and mortality at the time of diagnosis. J Natl Cancer Inst 2009;101(12):878–887 - PMC - PubMed
    1. Barocas DA, Cowan JE, Smith JA, Jr, Carroll PR. and the CaPSURE Investigators What percentage of patients with newly diagnosed carcinoma of the prostate are candidates for surveillance? an analysis of the CaPSURE database. J Urol 2008;180(4):1330–1334;discussion 1334–1335 - PubMed
    1. Kurhanewicz J, Vigneron D, Carroll P, Coakley F. Multiparametric magnetic resonance imaging in prostate cancer: present and future. Curr Opin Urol 2008;18(1):71–77 - PMC - PubMed
    1. Mullerad M, Hricak H, Wang L, Chen HN, Kattan MW, Scardino PT. Prostate cancer: detection of extracapsular extension by genitourinary and general body radiologists at MR imaging. Radiology 2004;232(1):140–146 - PubMed
    1. Wang L, Hricak H, Kattan MW, et al. Prediction of seminal vesicle invasion in prostate cancer: incremental value of adding endorectal MR imaging to the Kattan nomogram. Radiology 2007;242(1):182–188 - PubMed

Publication types

Substances