

Parvalbumin deficiency and GABAergic dysfunction in mice lacking PGC-1alpha
- PMID: 20505089
- PMCID: PMC2888101
- DOI: 10.1523/JNEUROSCI.0698-10.2010
Parvalbumin deficiency and GABAergic dysfunction in mice lacking PGC-1alpha
Abstract
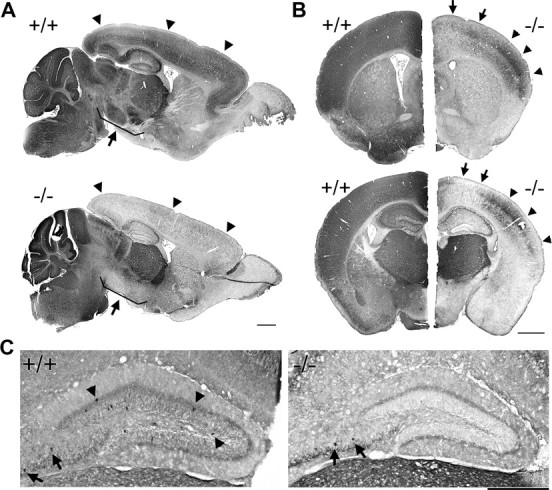
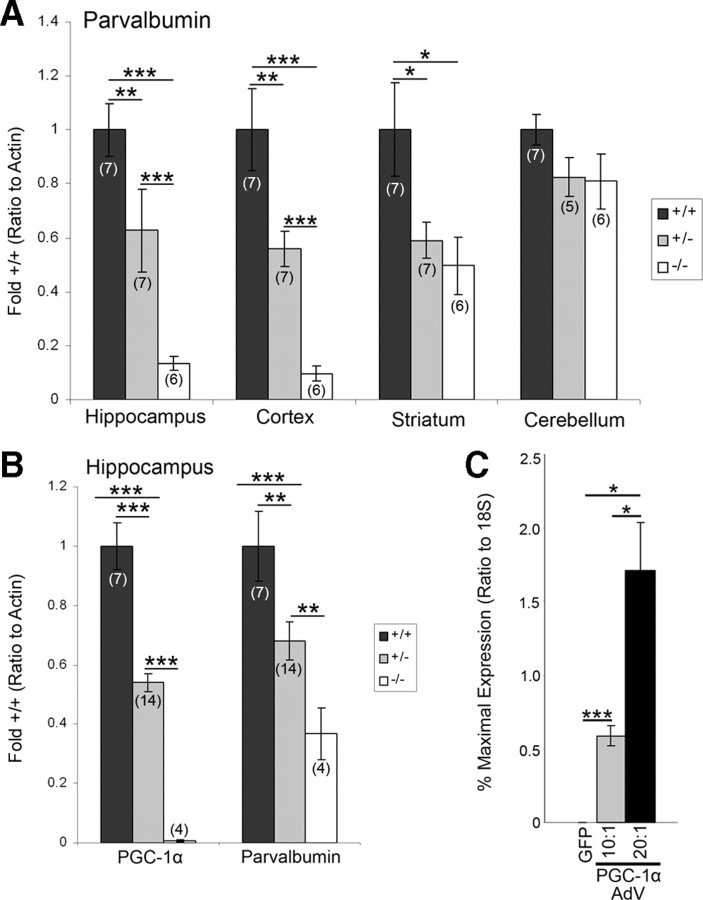
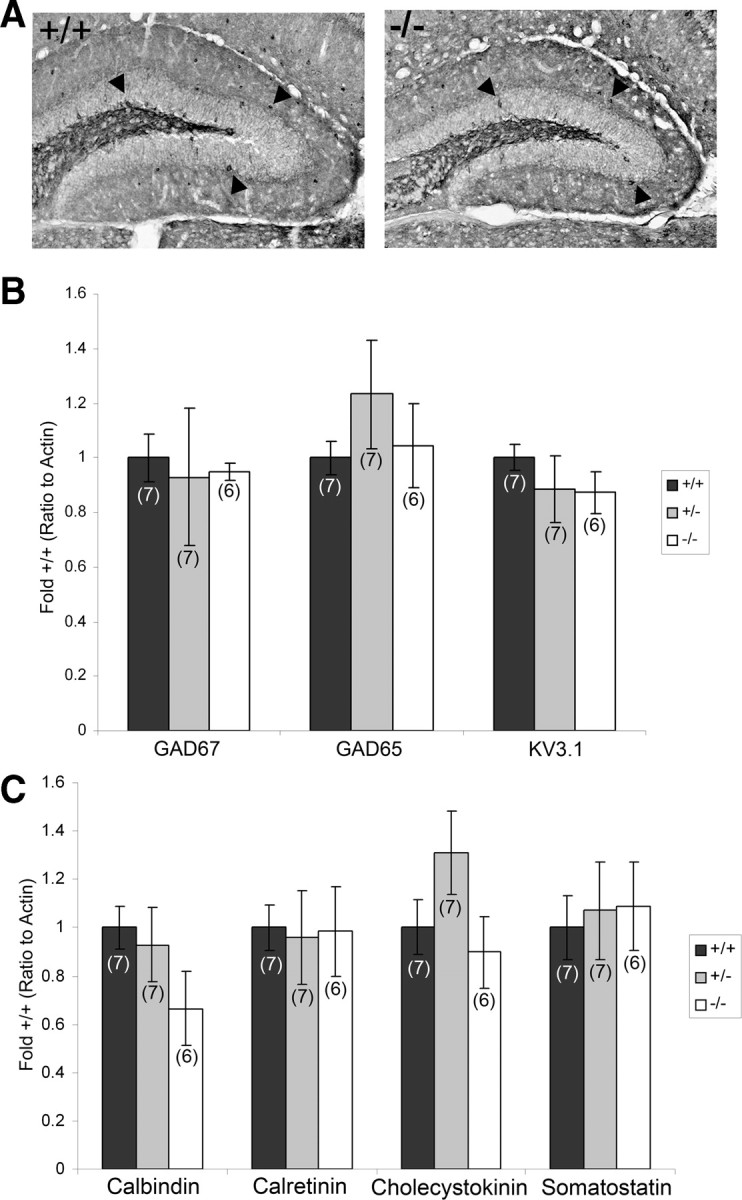
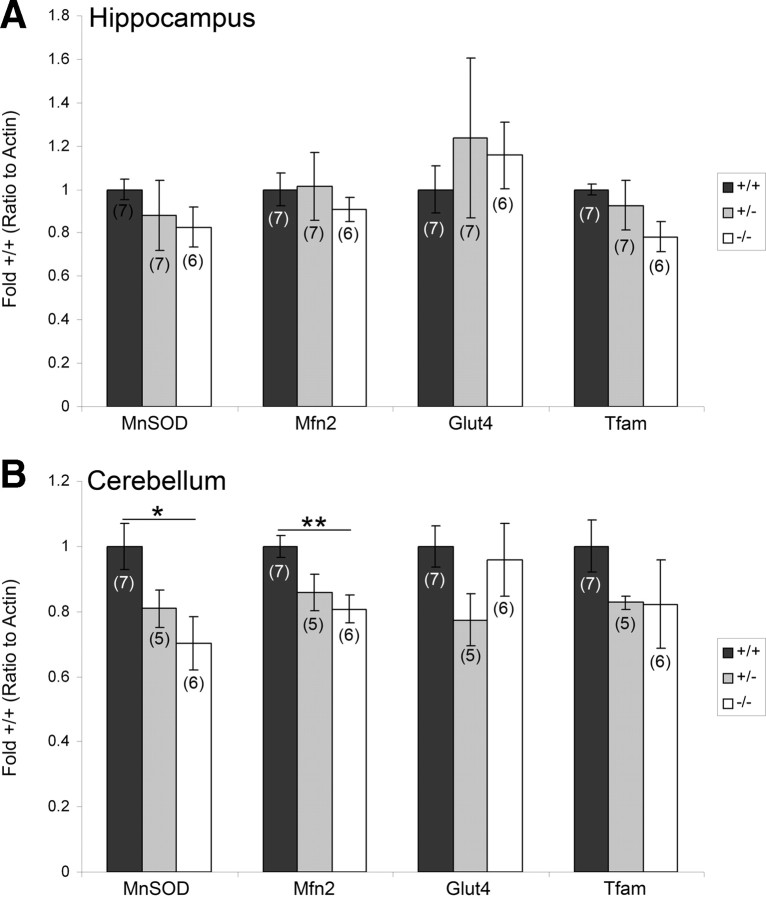
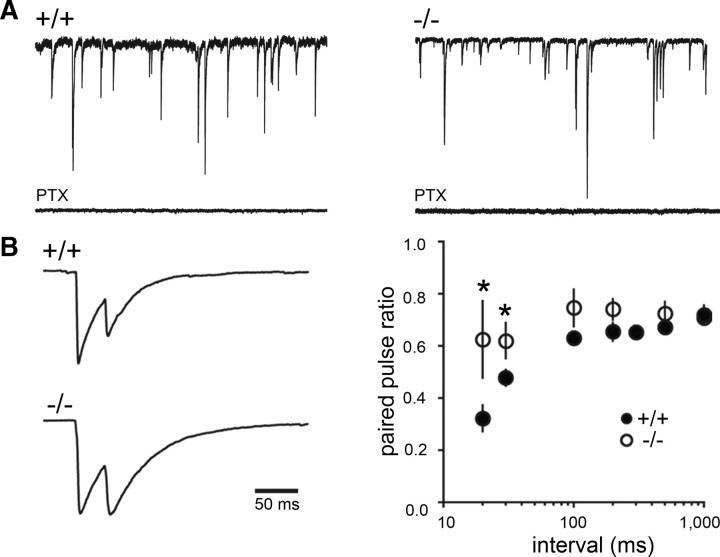
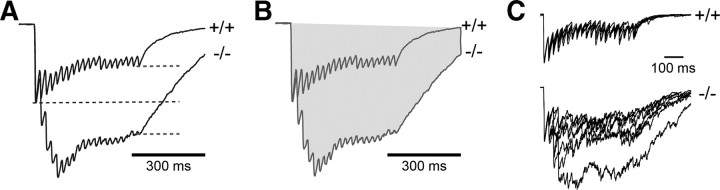
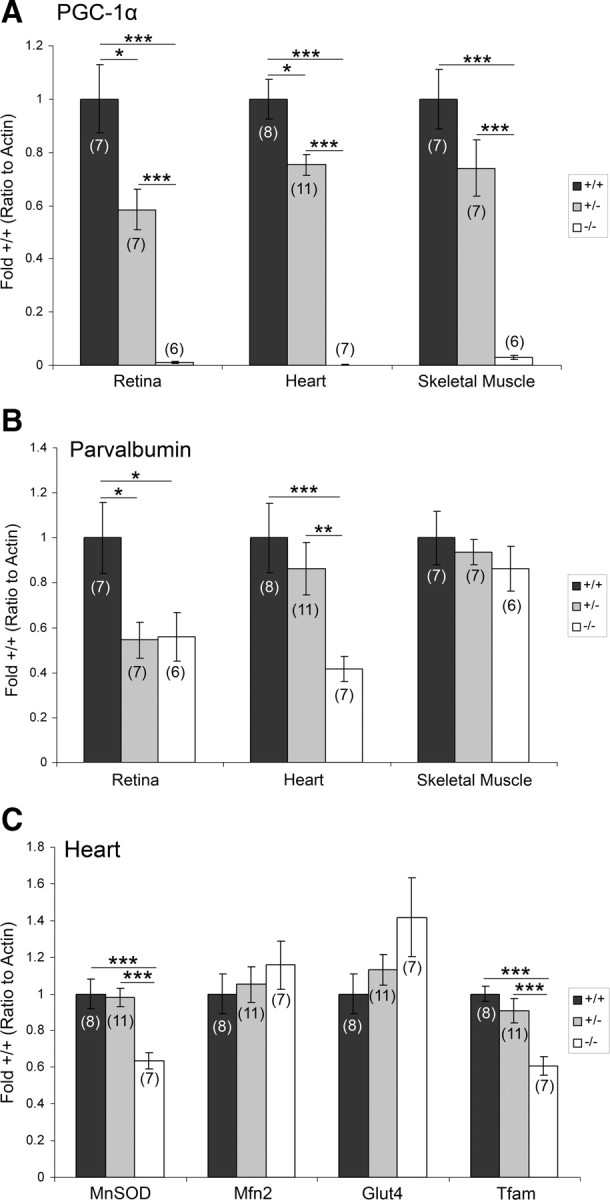
The transcriptional coactivator peroxisome proliferator-activated receptor gamma coactivator 1alpha (PGC-1alpha) is a master regulator of metabolism in peripheral tissues, and it has been proposed that PGC-1alpha plays a similar role in the brain. Recent evidence suggests that PGC-1alpha is concentrated in GABAergic interneurons, so we investigated whether male and female PGC-1alpha -/- mice exhibit abnormalities in interneuron gene expression and/or function. We found a striking reduction in the expression of the Ca(2+)-binding protein parvalbumin (PV), but not other GABAergic markers, throughout the cerebrum in PGC-1alpha +/- and -/- mice. Furthermore, PGC-1alpha overexpression in cell culture was sufficient to robustly induce PV expression. Consistent with a reduction in PV rather than a loss of PV-expressing interneurons, spontaneous synaptic inhibition was not altered in PGC-1alpha -/- mice. However, evoked synaptic responses displayed less paired-pulse depression and dramatic facilitation in response to repetitive stimulation at the gamma frequency. PV transcript expression was also significantly reduced in retina and heart of PGC-1alpha -/- animals, suggesting that PGC-1alpha is required for proper expression of PV in multiple tissues. Together these findings indicate that PGC-1alpha is a novel regulator of interneuron gene expression and function and a potential therapeutic target for neurological disorders associated with interneuron dysfunction.
Figures
Similar articles
-
Mice lacking the transcriptional coactivator PGC-1α exhibit alterations in inhibitory synaptic transmission in the motor cortex.Neuroscience. 2014 Jun 20;271:137-48. doi: 10.1016/j.neuroscience.2014.04.023. Epub 2014 Apr 24. Neuroscience. 2014. PMID: 24769433 Free PMC article.
-
Interneuron Transcriptional Dysregulation Causes Frequency-Dependent Alterations in the Balance of Inhibition and Excitation in Hippocampus.J Neurosci. 2015 Nov 18;35(46):15276-90. doi: 10.1523/JNEUROSCI.1834-15.2015. J Neurosci. 2015. PMID: 26586816 Free PMC article.
-
PGC-1α provides a transcriptional framework for synchronous neurotransmitter release from parvalbumin-positive interneurons.J Neurosci. 2014 Oct 22;34(43):14375-87. doi: 10.1523/JNEUROSCI.1222-14.2014. J Neurosci. 2014. PMID: 25339750 Free PMC article.
-
PV-specific loss of the transcriptional coactivator PGC-1α slows down the evolution of epileptic activity in an acute ictogenic model.J Neurophysiol. 2022 Jan 1;127(1):86-98. doi: 10.1152/jn.00295.2021. Epub 2021 Nov 17. J Neurophysiol. 2022. PMID: 34788174 Free PMC article.
-
PGC-1α: a master gene that is hard to master.Cell Mol Life Sci. 2012 Aug;69(15):2465-8. doi: 10.1007/s00018-012-1043-0. Epub 2012 Jun 9. Cell Mol Life Sci. 2012. PMID: 22678664 Free PMC article. Review.
Cited by
-
Inverse regulation of the cytosolic Ca²⁺ buffer parvalbumin and mitochondrial volume in muscle cells via SIRT1/PGC-1α axis.PLoS One. 2012;7(9):e44837. doi: 10.1371/journal.pone.0044837. Epub 2012 Sep 13. PLoS One. 2012. PMID: 23028640 Free PMC article.
-
Bicuculline restores frequency-dependent hippocampal I/E ratio and circuit function in PGC-1ɑ null mice.Neurosci Res. 2022 Nov;184:9-18. doi: 10.1016/j.neures.2022.07.003. Epub 2022 Jul 14. Neurosci Res. 2022. PMID: 35842011 Free PMC article.
-
Developmental alterations in motor coordination and medium spiny neuron markers in mice lacking pgc-1α.PLoS One. 2012;7(8):e42878. doi: 10.1371/journal.pone.0042878. Epub 2012 Aug 14. PLoS One. 2012. PMID: 22916173 Free PMC article.
-
A Selective Review of the Excitatory-Inhibitory Imbalance in Schizophrenia: Underlying Biology, Genetics, Microcircuits, and Symptoms.Front Cell Dev Biol. 2021 Oct 21;9:664535. doi: 10.3389/fcell.2021.664535. eCollection 2021. Front Cell Dev Biol. 2021. PMID: 34746116 Free PMC article. Review.
-
Age-Related Deterioration of Perineuronal Nets in the Primary Auditory Cortex of Mice.Front Aging Neurosci. 2016 Nov 8;8:270. doi: 10.3389/fnagi.2016.00270. eCollection 2016. Front Aging Neurosci. 2016. PMID: 27877127 Free PMC article.
References
-
- Bartos M, Vida I, Jonas P. Synaptic mechanisms of synchronized gamma oscillations in inhibitory interneuron networks. Nat Rev Neurosci. 2007;8:45–56. - PubMed
-
- Celio MR, Heizmann CW. Calcium-binding protein parvalbumin is associated with fast contracting muscle fibres. Nature. 1982;297:504–506. - PubMed
Publication types
MeSH terms
Substances
Grants and funding
LinkOut - more resources
Full Text Sources
Molecular Biology Databases
Miscellaneous