. 2010 May 26;30(21):7236-48.
doi: 10.1523/JNEUROSCI.0736-10.2010.

Dopaminergic modulation of endocannabinoid-mediated plasticity at GABAergic synapses in the prefrontal cortex

Affiliations

Dopaminergic modulation of endocannabinoid-mediated plasticity at GABAergic synapses in the prefrontal cortex

Chiayu Q Chiu et al. J Neurosci. .

Abstract

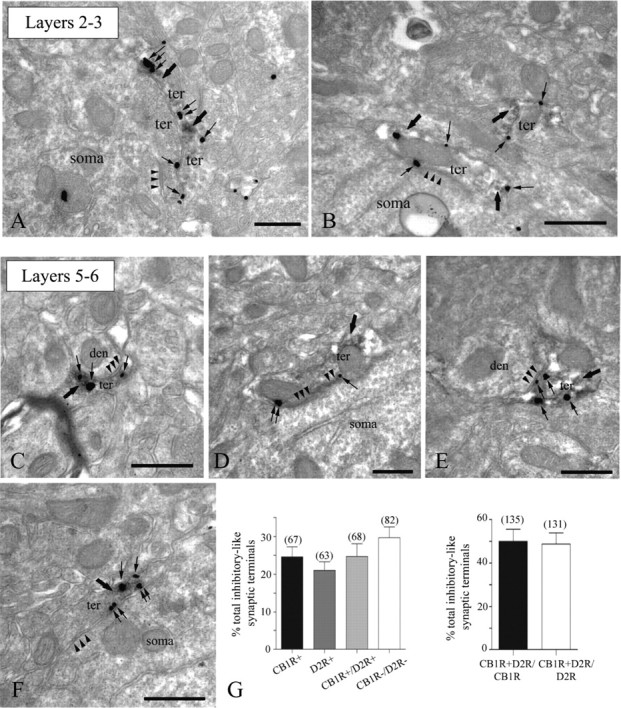
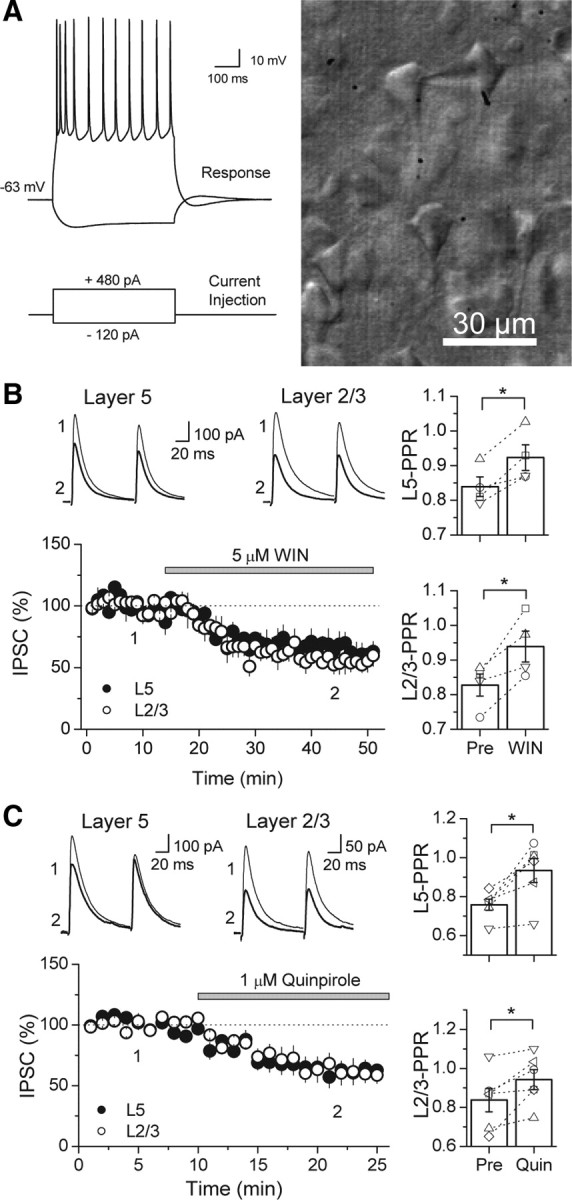
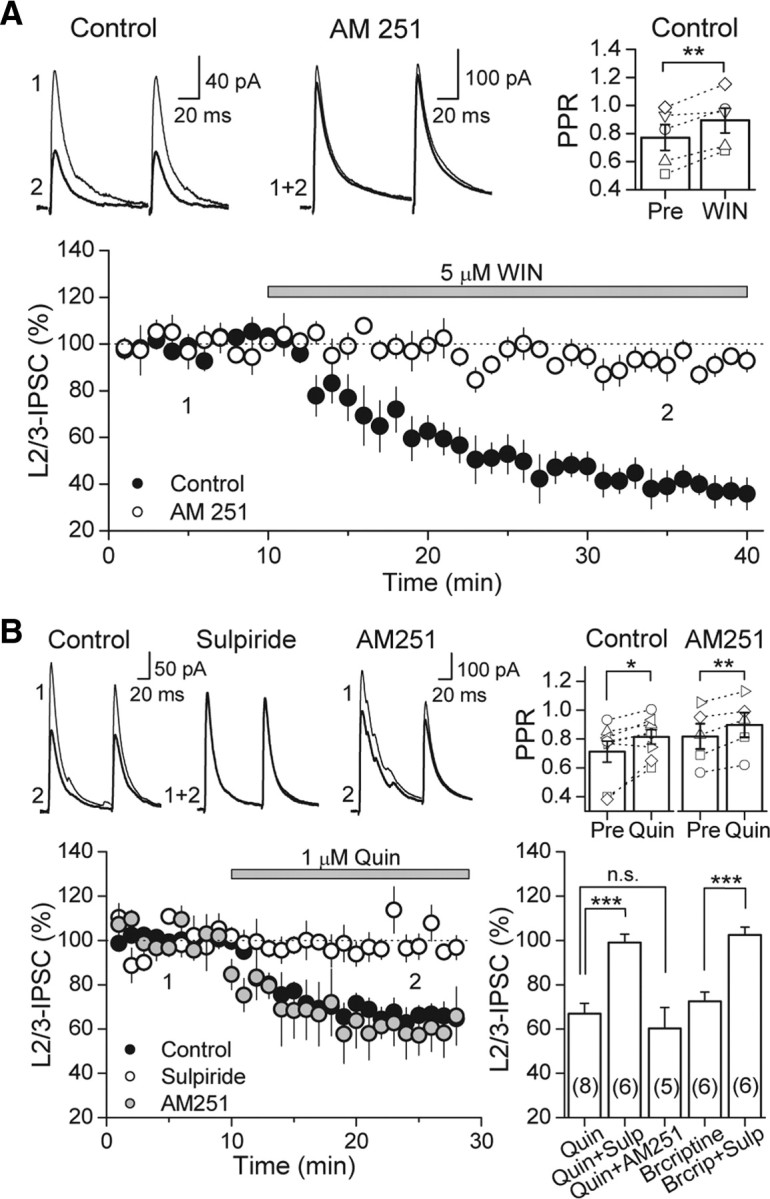
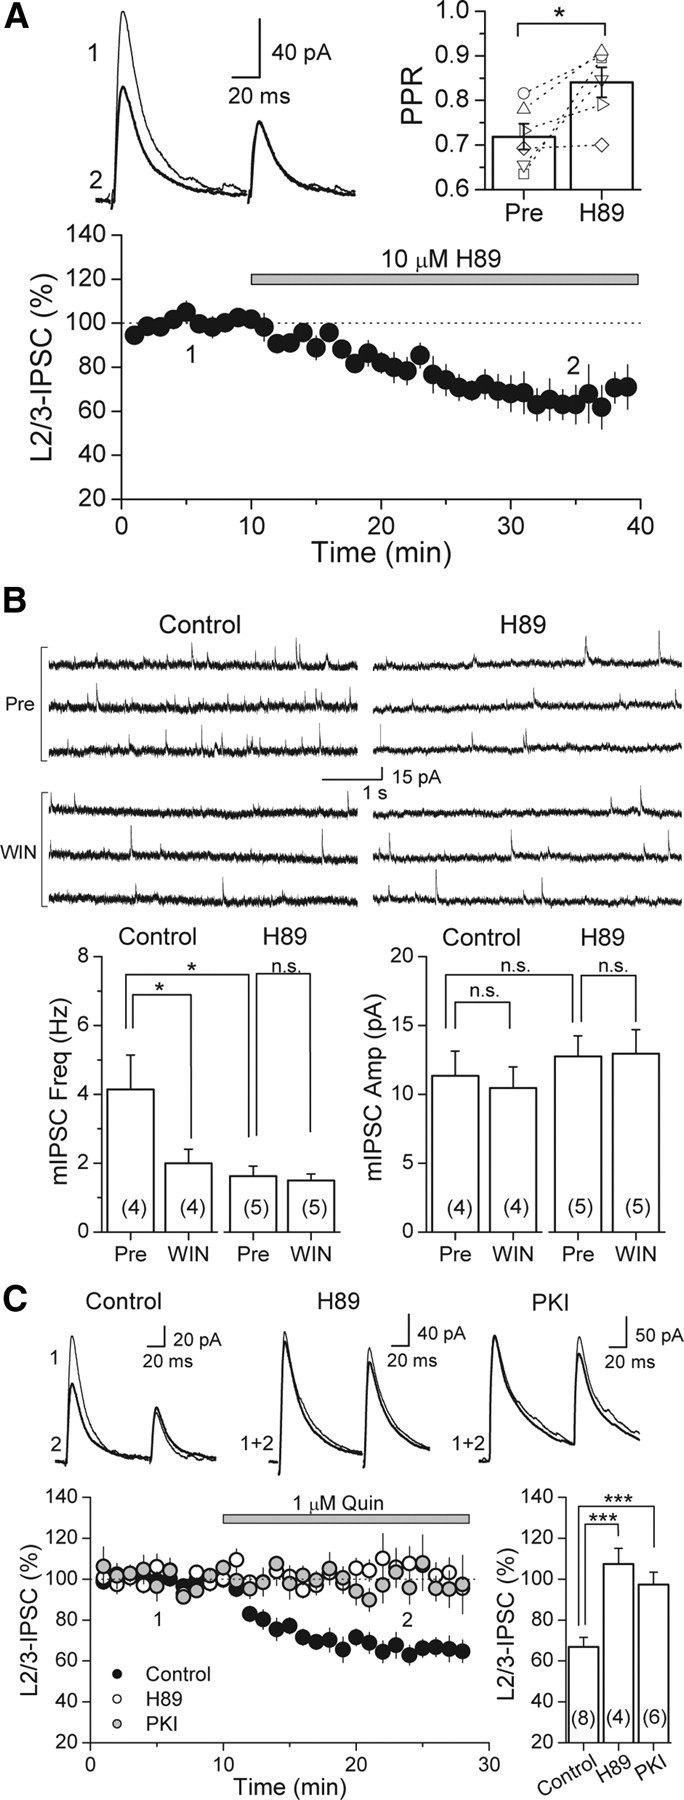
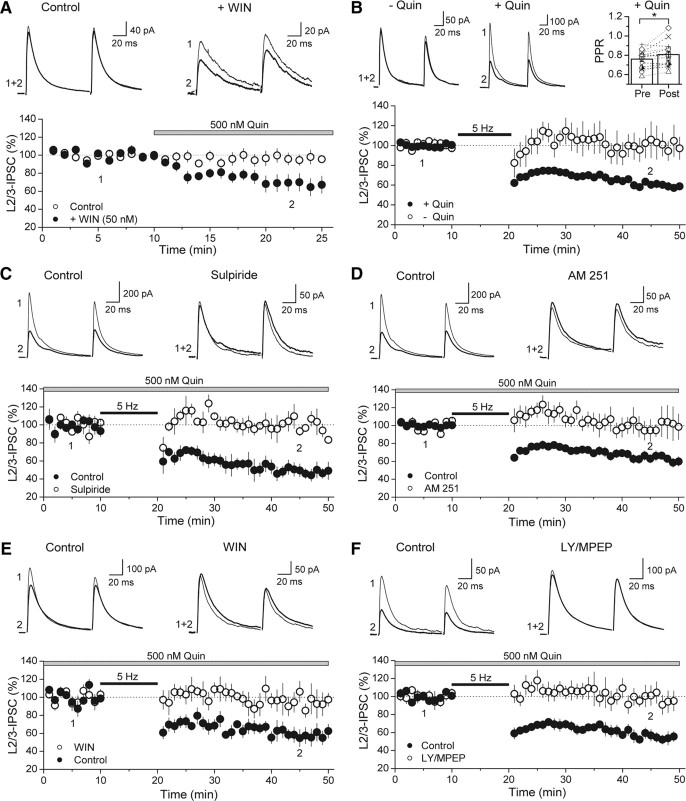
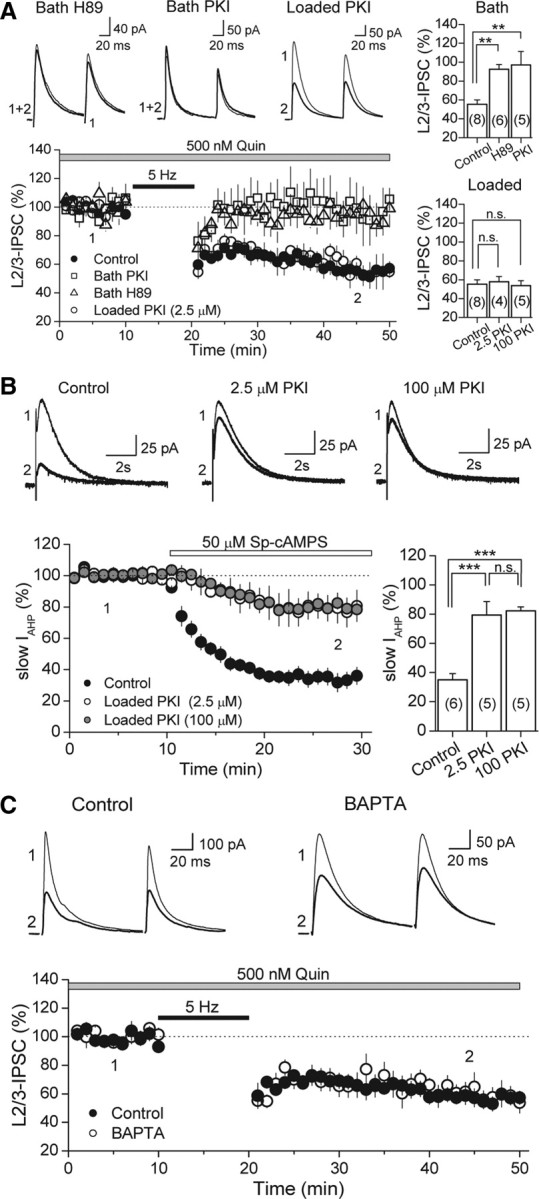
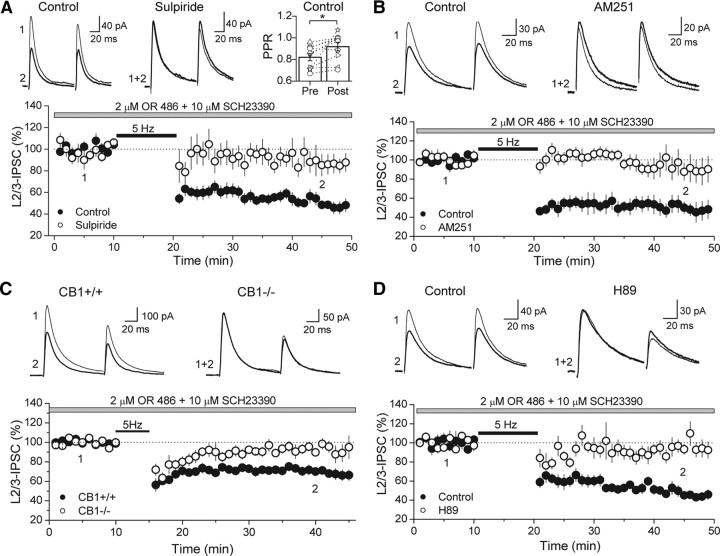
Similar to dopamine (DA), cannabinoids strongly influence prefrontal cortical functions, such as working memory, emotional learning, and sensory perception. Although endogenous cannabinoid receptors (CB(1)Rs) are abundantly expressed in the prefrontal cortex (PFC), very little is known about endocannabinoid (eCB) signaling in this brain region. Recent behavioral and electrophysiological evidence has suggested a functional interplay between the dopamine and cannabinoid receptor systems, although the cellular mechanisms underlying this interaction remain to be elucidated. We examined this issue by combining neuroanatomical and electrophysiological techniques in PFC of rats and mice (both genders). Using immunoelectron microscopy, we show that CB(1)Rs and dopamine type 2 receptors (D(2)Rs) colocalize at terminals of symmetrical, presumably GABAergic, synapses in the PFC. Indeed, activation of either receptor can suppress GABA release onto layer 5 pyramidal cells. Furthermore, coactivation of both receptors via repetitive afferent stimulation triggers eCB-mediated long-term depression of inhibitory transmission (I-LTD). This I-LTD is heterosynaptic in nature, requiring glutamate release to activate group I metabotropic glutamate receptors. D(2)Rs most likely facilitate eCB signaling at the presynaptic site as disrupting postsynaptic D(2)R signaling does not diminish I-LTD. Facilitation of eCB-LTD may be one mechanism by which DA modulates neuronal activity in the PFC and regulates PFC-mediated behavior in vivo.


Figures

Figure 1.
Figure 1.
Colocalization of presynaptic CB1R and D2R at symmetrical synapses in the mouse PFC. Double labeling of receptors by combining a pre-embedding immunogold (CB1R) and an immunoperoxidase (D2R) method for electron microscopy (A–F). D2R-immunoreactive (thick arrows) presynaptic axon terminals (ter) forming symmetrical synapses (arrowheads) with small dendrites (den) and cell bodies (soma) colocalize with CB1R immunoparticles (thin arrows) at their perisynaptic and extrasynaptic membranes. Note in A CB1R immunolabeling (thin arrows) in a D2R-immunonegative synaptic bouton making a somatic symmetrical synapse (arrowheads). Scale bars, 0.5 μm. G, Left, percentages (mean ± SEM) of the total number of symmetrical synapses analyzed (n = 280) containing CB1R alone, D2R alone, both CB1R and D2R, and neither CB1R nor D2R in layers 5/6 of the mouse PFC. Right, Approximately 50% of CB1R-immunopositive inhibitory-like synaptic terminals have D2R immunoreactivity, and 50% of D2R immunoreactive symmetrical boutons are also equipped with CB1R immunometals.
Figure 2.
Figure 2.
Pharmacological activation of CB1Rs or D2Rs suppresses GABAergic responses evoked by stimulation in layers (L) 2/3 and 5 in the mouse PFC. A, Left, Representative response of whole-cell patched layer 5 pyramidal cell in current clamp (above) while depolarizing or hyperpolarizing current injections were delivered (below) to show that targeting cells in layer 5 by their shape is a reliable way of patching pyramidal cells. Note the initial spike adaption, followed by a slow regular spiking behavior. Right, Photograph of image under IR-DIC microscopy of a patched cell in layer 5 of the PFC exhibiting a pyramidal cell-like morphology. B, Time course of WIN 55,212-2 suppression on both proximal (black circles) and distal (white circles) GABAergic inputs in the mouse PFC (n = 4 cells). Top, Representative average IPSC traces from a single experiment, obtained at the time points in the time course graph. Right, Bar graph of the average PPR before and after WIN application. Open symbols represent the PPR of individual experiments. C, Time course of quinpirole (Quin) suppression on both proximal (black circles) and distal (white circles) GABAergic inputs in the mouse PFC (n = 6 cells). Top, Representative average IPSC traces from an individual experiment, obtained at the time points indicated. Right, Bar graph of the average PPR before and after quinpirole application. Open symbols represent the PPR of individual experiments. *p < 0.05.
Figure 3.
Figure 3.
Activation of CB1R or D2R suppresses GABAergic transmission in the rat PFC. A, Time course of WIN suppression of IPSC amplitudes in the rat PFC (black circles), which is abolished in CB1R blockade with 4 μm AM 251 (white circles). Top left, Representative average IPSC traces from a single control experiment, obtained at time points indicated. Top right, PPR plot before and after WIN application. PPR of layer (L) 2/3 IPSCs significantly increased. Open symbols represent the PPR of individual experiments. B, Time course of quinpirole (Quin) suppression of IPSC amplitudes in the rat PFC in control (black circles), under D2R antagonism with 10 μm sulpiride (Sulp; white circles), and under CB1R block with 4 μm AM 251 (gray circles). Top left, Representative average IPSC traces from a single control experiment. Top right, PPR plot before and after quinpirole application. PPR of layer 2/3 IPSCs significantly increased under control conditions and in AM 251. Open symbols represent the PPR of individual experiments. Bottom right, Summary plot of suppression mediated by D2R agonists quinpirole (1 μm) and bromocriptine (Brcriptine; 2 μm). Effects of both drugs were blocked by sulpiride. However, AM 251 had no effect on quinpirole suppression. The number of experiments for each condition is indicated in parentheses. *p < 0.05, **p < 0.01, ***p < 0.005.
Figure 4.
Figure 4.
Inhibiting PKA activity with H89 reduces GABA release and occludes WIN and quinpirole suppression of GABAergic transmission in the rat PFC. A, Time course of H89 suppression of IPSC amplitudes in the rat PFC (n = 6 cells). Top left, Representative average IPSC traces from a single experiment, obtained at the time points indicated. Top right, PPR plot before and after H89 application. PPR of layer (L) 2/3 IPSCs significantly increased. Open symbols represent the PPR of individual experiments. B, WIN suppression of mIPSC frequency in control is absent in slices preincubated in 10 μm H89. Top left, Three representative mIPSC traces from a single control experiment before and after WIN application. Top right, Three representative mIPSC traces from a single H89 experiment before and after WIN application. C, Quinpirole (Quin) suppression of IPSC amplitudes in control (black circles) is absent in slices preincubated in either 10 μm H89 (white circles) or 2.5 μm PKI 14–22 (gray circles). Top, Representative average IPSC traces from single experiments. Bottom right, Summary plot of quinpirole suppression in control and block under PKA inhibition by H89 and PKI 14–22. The number of experiments for each condition is indicated in parentheses. *p < 0.05, ***p < 0.005.
Figure 5.
Figure 5.
I-LTD can be triggered by a 5 Hz train of synaptic stimulation in the presence of low-dose quinpirole. A, Time course of 500 nm quinpirole effect on IPSC amplitude in the presence (black circles) or absence (white circles) of 50 nm WIN. Preincubation with a submaximal dose of WIN (+WIN) reveals the suppressive effect of an otherwise ineffective dose of quinpirole (control). Top, Representative average IPSC traces from single experiments obtained from the time points indicated. B, Time course plot of average IPSC amplitudes before and after 5 Hz stimulation train in the absence (white circles) or presence (black circles) of quinpirole. Responses only persistently depressed as a result of 5 Hz stimulation when D2R agonist is in the bath (+Quin). Top left, Representative average IPSC traces from single experiments obtained from the time points indicated. Top right, Plot of PPR before and after train in the presence of D2R agonist. Open symbols represent single experiments. C, Time course of control I-LTD (black circles) and the absence of I-LTD under D2R antagonism with 10 μm sulpiride (white circles). Top, Representative average IPSC traces from a single control and sulpiride block experiment. D, Time course of control I-LTD (black circles) and the absence of I-LTD in the presence of 4 μm AM 251 (white circles). Top, Representative average IPSC traces from a single control and AM 251 block experiment. E, Time course of control I-LTD (black circles) and its absence in slices that were preincubated in 5 μm WIN (white circles). Top, Representative average IPSC traces from a single control and WIN occlusion experiment. F, Time course of control I-LTD (black circles) and the lack of I-LTD in the presence of group I mGluR antagonists (white circles). Top, Representative average IPSC traces from single control and block experiments. *p < 0.05. L, Layer; LY, LY367385.
Figure 6.
Figure 6.
Neither postsynaptic PKA nor intracellular calcium rise is required for I-LTD. A, Time course of I-LTD in interleaved controls (black circles), bath-applied H89 (10 μm; white triangles), bath-applied PKI 14–22 peptide (2.5 μm; white squares), and cells loaded with 2.5 μm PKI 6–22 peptide (white circles). Inhibiting PKA activity in the slice blocks I-LTD, but inclusion of PKI (at either 2.5 or 100 μm) in the postsynaptic cell does not, as depicted in the summary bar plots on the top and bottom right. Top, Representative average IPSC traces from single H89 and PKI experiments obtained from the time points indicated. B, Verification that intracellular loading of the PKI 6–22 peptide effectively inhibits postsynaptic PKA activity. PKI loaded into CA1 pyramidal cells at either 2.5 or 100 μm significantly reduced the inhibition of slow AHP current (IAHP) induced by bath application of a specific PKA activator (Sp-cAMPS). Top, Representative average AHP traces from single experiments at the time points indicated. Bottom right, Summary bar plot depicting the effect of loading PKI on slow IAHP inhibition. C, Time course of I-LTD in control (black circles) and in cells loaded with 20 mm BAPTA (white circles). Chelating postsynaptic calcium has no effect on I-LTD. Top, Representative average IPSC traces from single experiments. The number of experiments for each condition is indicated in parentheses. **p < 0.01, ***p < 0.005. L, Layer; Quin, quinpirole.
Figure 7.
Figure 7.
Increasing endogenous DA levels by inhibiting COMT also enables I-LTD. A, The 5 Hz stimulation in the presence of the COMT inhibitor OR 486 and the D1R antagonist SCH23390 elicited I-LTD (black circles) that was sensitive to D2R antagonist sulpiride (white circles). Top left, Representative average traces from single experiments obtained at the time points indicated. Top right, Plot of PPR before and after delivery of 5 Hz train, showing a change in PPR. B, This I-LTD (black circles) was also sensitive to the CB1R antagonist AM 251 (white circles). Top, Representative average traces from single experiments obtained at time points indicated. C, In the wild-type mouse (CB1+/+), a weaker 5 Hz train (for 5 min) triggers I-LTD in the presence of OR 486 and SCH23390. This I-LTD is not present in the CB1 knock-out littermates (CB1−/−). Top, Representative average traces from single experiments obtained at the time points indicated. D, Time course of I-LTD in the presence of OR 486 and SCH23390 in control (black circles) and in slices bath applied with H89 (white circles). Top, Representative average IPSC traces from single control and H89 block experiments in the rat PFC obtained at the time points indicated. L, Layer.

References

    1. Ariano MA, Sibley DR. Dopamine receptor distribution in the rat CNS: elucidation using anti-peptide antisera directed against D1A and D3 subtypes. Brain Res. 1994;649:95–110. - PubMed
    1. Auclair N, Otani S, Soubrie P, Crepel F. Cannabinoids modulate synaptic strength and plasticity at glutamatergic synapses of rat prefrontal cortex pyramidal neurons. J Neurophysiol. 2000;83:3287–3293. - PubMed
    1. Azad SC, Monory K, Marsicano G, Cravatt BF, Lutz B, Zieglgänsberger W, Rammes G. Circuitry for associative plasticity in the amygdala involves endocannabinoid signaling. J Neurosci. 2004;24:9953–9961. - PMC - PubMed
    1. Beltramo M, de Fonseca FR, Navarro M, Calignano A, Gorriti MA, Grammatikopoulos G, Sadile AG, Giuffrida A, Piomelli D. Reversal of dopamine D2 receptor responses by an anandamide transport inhibitor. J Neurosci. 2000;20:3401–3407. - PMC - PubMed
    1. Bodor AL, Katona I, Nyíri G, Mackie K, Ledent C, Hájos N, Freund TF. Endocannabinoid signaling in rat somatosensory cortex: laminar differences and involvement of specific interneuron types. J Neurosci. 2005;25:6845–6856. - PMC - PubMed

Publication types

MeSH terms

Substances

LinkOut - more resources