. 2010 Nov;51(11):5470-9.
doi: 10.1167/iovs.10-5429. Epub 2010 May 26.

Mitochondrial DNA damage as a potential mechanism for age-related macular degeneration

Affiliations

Mitochondrial DNA damage as a potential mechanism for age-related macular degeneration

Pabalu P Karunadharma et al. Invest Ophthalmol Vis Sci. 2010 Nov.

Abstract

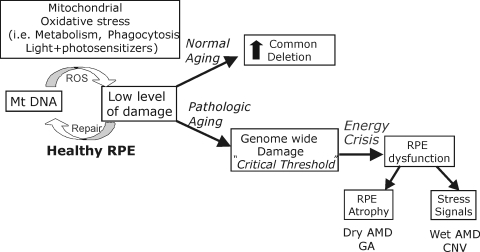
Purpose: Increasing evidence suggests a central role for mitochondrial (mt) dysfunction in age-related macular degeneration (AMD). Previous proteomic data from the retinal pigment epithelium (RPE) revealed significant changes to mt proteins, suggesting potential functional defects and damage to mitochondrial DNA (mtDNA) with AMD progression. The present study tests the hypothesis that mtDNA damage increases with aging and AMD.

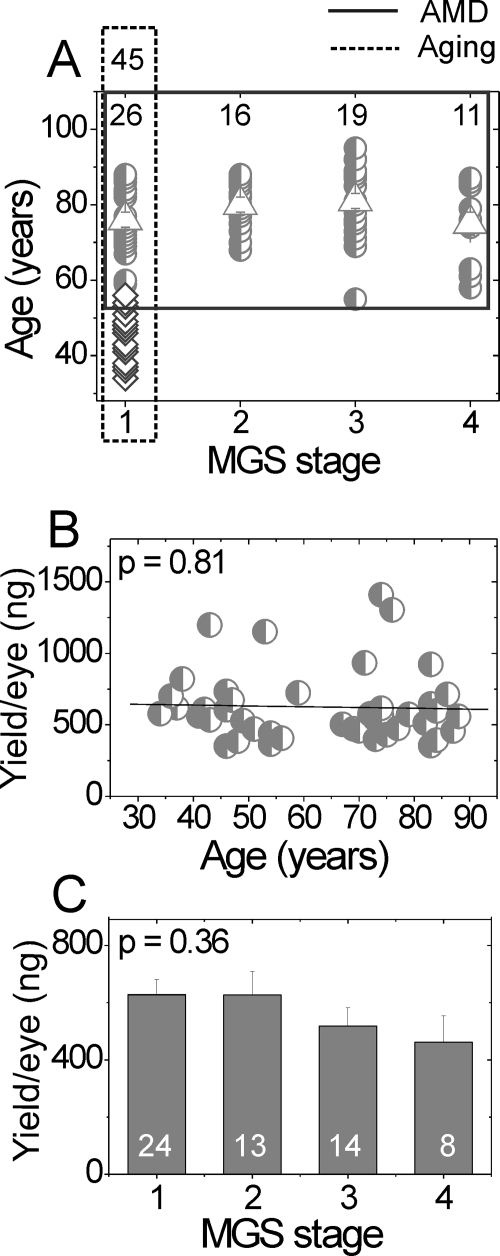
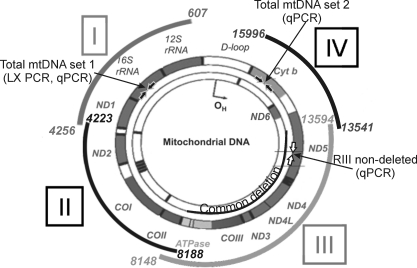
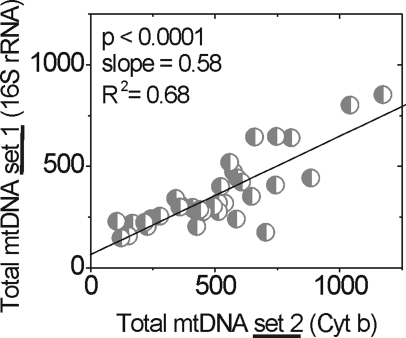
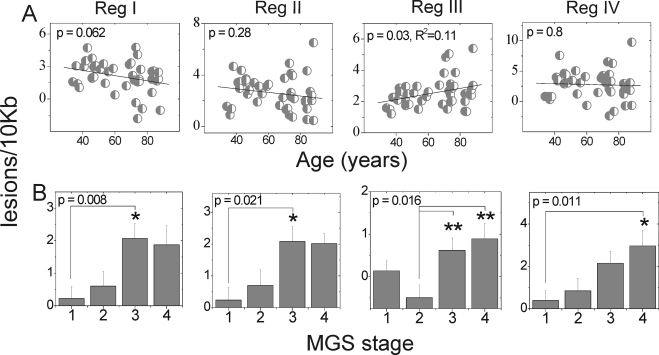
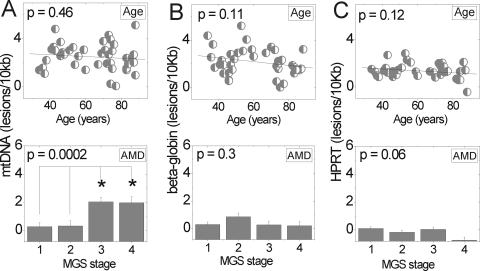
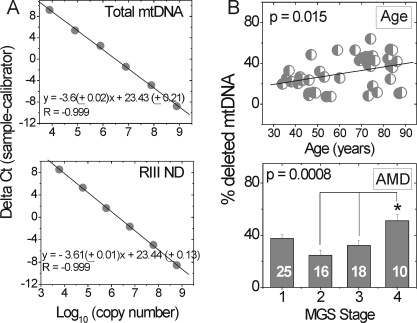
Methods: Genomic DNA was isolated from the macular region of human donor RPE graded for stages of AMD (Minnesota Grading System [MGS] 1-4). Region-specific mtDNA damage with normal aging was evaluated in 45 control subjects (ages 34-88 years, MGS 1) and AMD-associated damage in diseased subjects (n = 46), compared with that in age-matched control subjects (n = 26). Lesions per 10 kb per genome in the mtDNA and nuclear DNA were measured with long-extension polymerase chain reaction (LX PCR). The level of deleted mtDNA in each donor was measured with quantitative real-time PCR (qPCR).

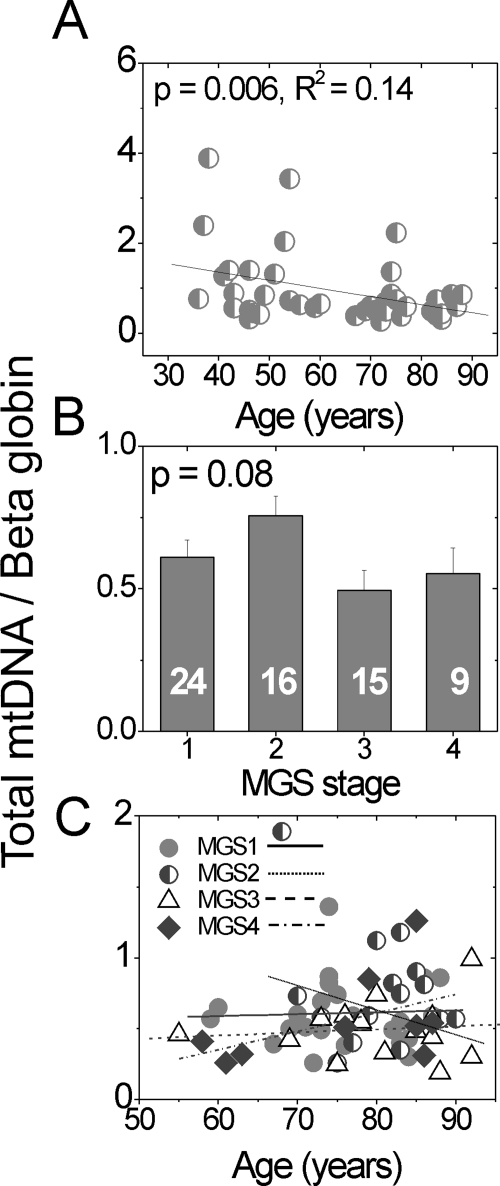
Results: With aging, an increase in mtDNA damage was observed only in the common deletion region of the mt genome. In contrast, with AMD, mtDNA lesions increased significantly in all regions of the mt genome beyond levels found in age-matched control subjects. mtDNA accumulated more lesions than did two nuclear genes, with total damage of the mt genome estimated to be eight times higher.

Conclusions: Collectively, the data indicate that mtDNA is preferentially damaged with AMD progression. These results suggest a potential link between mt dysfunction due to increased mtDNA lesions and AMD.


Figures

Figure 1.
Figure 1.
Donor ages and DNA yield in aging and AMD comparisons. (A) Age of donors. Dashed line: outlines the control donors used in the aging comparison (n = 45). Diamonds: donors aged 34 to 56 years (n = 19); circles: donors aged 59 to 88 (n = 26). These donors (circles) are also the age-matched control subjects for comparison with the AMD group. Solid line: outlines the age-matched donors (half-filled circles) used in the AMD-comparison (n = 72). The number of donors for each MGS stage is shown at top. Triangles: mean age of each age-matched MGS group. No significant difference was detected for the mean age of each MGS stage (one-way ANOVA, P = 0.18). (B, C) DNA yield for control (MGS 1) donors in the aging comparison (B) and the AMD comparison (C). Data are the mean ± SEM. DNA was isolated from a macular punch. No significant difference was detected for DNA yield with either aging (regression analysis, P = 0.81) or MGS stage (one-way ANOVA, P = 0.36).
Figure 2.
Figure 2.
Primer locations within the mt genome. Primers were designed to amplify discrete regions (I-IV) of the mt genome. The area spanned by each region is shown as a curved segment outside the mt genome, and base pair locations are provided. The primer set amplifying a 191-bp region that gives a measure of the total amount of mtDNA (total mtDNA set 1) is shown within the 16S rRNA gene (filled block arrows). A second set of primers amplifying a 222-bp region in the Cyt b gene provided a second measure of total mtDNA content for this study (total mtDNA primer set 2, solid block arrows). The RIII-ND primer set, which binds within the CD, is shown in the ND5 gene (open block arrows). The 4977-bp CD is shown within the mt genome. 12S and 16S rRNA are genes for mt ribosomal RNA. Genes for electron transport proteins are ND1–6, COI-III, ATPase 6, ATPase 8, and Cyt b. D-loop is the noncoding region. The schematic of the mt genome was modified with permission from Taylor RW, Turnbull DM. Mitochondrial DNA mutations in human disease. Nat Rev Gen. 2005;6:389–402.
Figure 3.
Figure 3.
The total mtDNA content decreases with aging, not with AMD progression. Total mtDNA content compared to β-globin was calculated from amplification of small regions of the mt genome (set 1, 16S rRNA; Fig. 2) and nuclear β-globin gene using qPCR. Total mtDNA content (A) of each MGS 1 (control) donor, ages 34 to 88 years (n = 44); (B) of each MGS stage (mean ± SEM); and (C) as a function of age for each MGS category. Linear regression analysis demonstrated no significant relationship between age and mtDNA content (C, P > 0.12) for any MGS stage. The number of samples in each MGS category is shown in the respective columns. The assay was preformed in triplicate.
Figure 4.
Figure 4.
Comparison of two independent measures of total mtDNA content in donor samples. Two small fragments, 191 bp of 16S rRNA (total mtDNA set 1) and 222 bp of Cyt b gene (total mtDNA set 2), of the mt genome were amplified by using LX PCR. Comparison of these measures by linear regression shows highly significant correlation between the two measurements (n = 38).
Figure 5.
Figure 5.
mtDNA damage increased with AMD progression. Lesion frequency (lesions/10 kb/double strands) calculated for regions I, II, III, and IV of the mt genome using LX PCR was compared with age and AMD progression. (A) Comparison of lesion accumulation with aging (n = 43) normalized to the relative amplification of ARPE-19 DNA. (B) Comparison of mean lesion frequency (mean ± SEM) at stages of AMD (sample size: MGS 1, 25–26; MGS 2, 16–17; MGS 3, 17–18; and MGS 4, 10–11) normalized to average relative amplification of MGS 1 age-matched control subjects. Significance was set at P ≤ 0.05. All reactions were performed in triplicate for each sample. *Significantly different from MGS 1. **Significantly different from MGS 2.
Figure 6.
Figure 6.
mtDNA but not nDNA showed increased damage with AMD. (A) Lesion frequency for each region of the mt genome (Fig. 4) was averaged to determine total mtDNA lesions per genome for each donor. Lesion frequency for nDNA was calculated from amplification of (B) β-globin and (C) HPRT genes. A small fragment (147 bp) of the β-globin gene was amplified to normalize amplification to total amount of nuclear DNA in each sample. Top: comparison of lesion frequency with aging (n = 43, mtDNA, n = 40, β-globin, n = 43, HPRT). Bottom: total lesion frequency for each stage of AMD (mean ± SEM). Significance was set at P ≤ 0.05.
Figure 7.
Figure 7.
Deletions increased with aging and AMD. (A) The percentage of deleted mtDNA in each individual was quantified using standard curves generated for each primer set by serially diluting a known amount of copies. Template DNA for total mtDNA (primer set 1) and RIII ND primer sets were produced from ARPE-19 DNA. Equations shown were averaged from measurements repeated on 3 days. (B) Level of deleted mtDNA increased with aging (P = 0.015, R2 = 0.17, n = 44) and with AMD (P = 0.0008). The number of samples used for each MGS stage is reported in the respective columns. All reactions were performed in triplicate for each sample. *Significantly different from MGS 2 and 3.
Figure 8.
Figure 8.
Putative model of the pathologic course of AMD. Under normal conditions, RPE mtDNA damage is maintained at low levels. With normal aging, mtDNA damage occurs in the CD region, affecting perhaps up to 40% of mtDNA genomes by age 90. With AMD, damage accumulates across the mt genome, affecting mt metabolism and RPE function. The damage can manifest in RPE atrophy and an imbalance in signaling factors, resulting in TGA and CNV that are associated with AMD.

References

    1. Friedman DS, O'Colmain BJ, Munoz B, et al. Prevalence of age-related macular degeneration in the United States. Arch Ophthalmol. 2004;122:564–572 - PubMed
    1. Brown MM, Brown GC, Sharma S, et al. The burden of age-related macular degeneration: a value-based analysis. Curr Opin Ophthalmol. 2006;17:257–266 - PubMed
    1. Brown DM, Kaiser PK, Michels M, et al. Ranibizumab versus verteporfin for neovascular age-related macular degeneration. N Engl J Med. 2006;355:1432–1444 - PubMed
    1. Rosenfeld PJ, Brown DM, Heier JS, et al. Ranibizumab for neovascular age-related macular degeneration. N Engl J Med. 2006;355:1419–1431 - PubMed
    1. Strauss O. The retinal pigment epithelium in visual function. Physiol Rev. 2005;85:845–881 - PubMed

Publication types

Substances