. 2010 May 26;2(33):33ra37.
doi: 10.1126/scitranslmed.3001006.

Metabolic signatures of exercise in human plasma

Affiliations

Metabolic signatures of exercise in human plasma

Gregory D Lewis et al. Sci Transl Med. .

Abstract

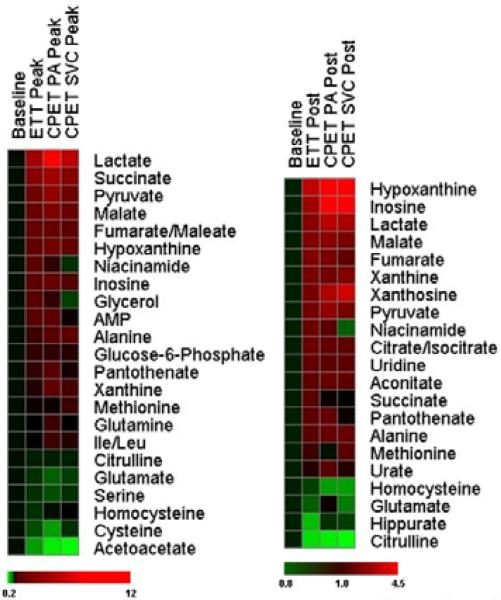
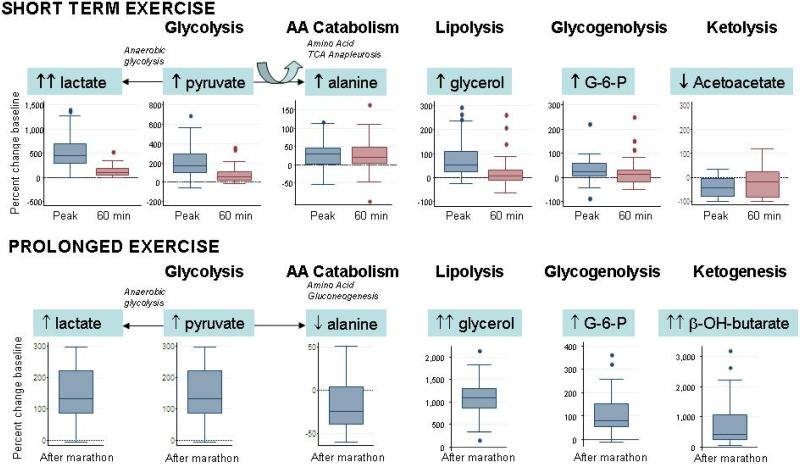
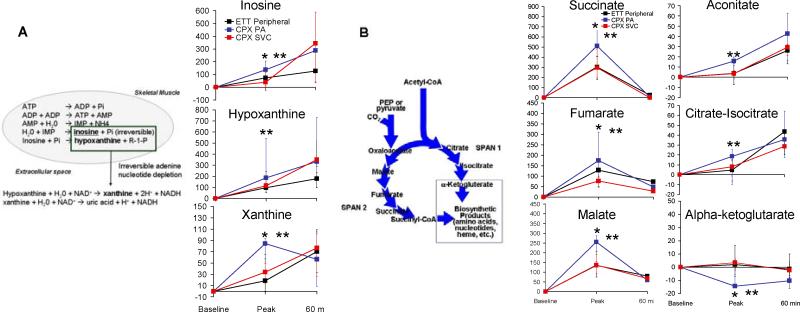
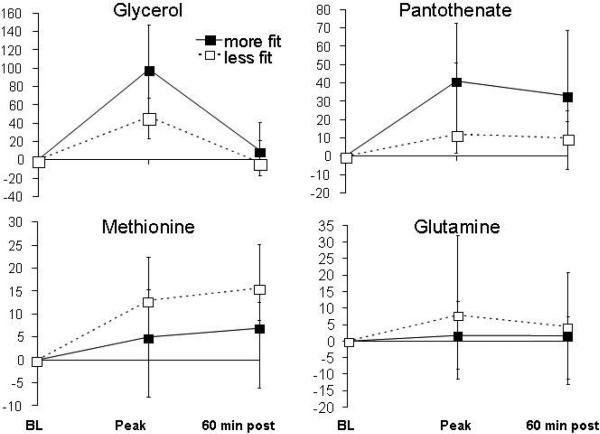
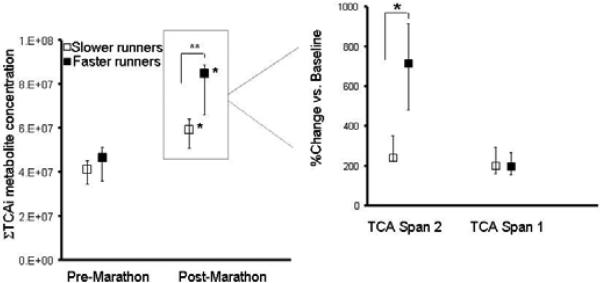
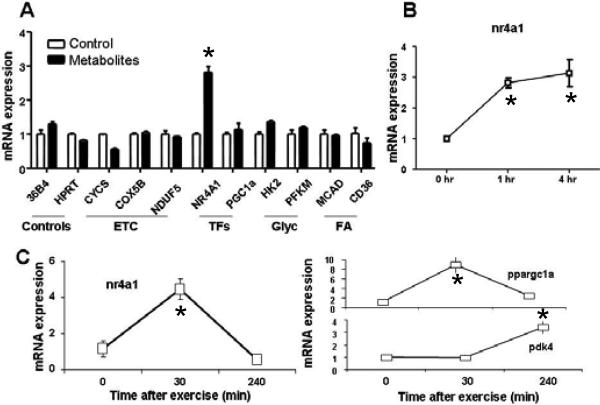
Exercise provides numerous salutary effects, but our understanding of how these occur is limited. To gain a clearer picture of exercise-induced metabolic responses, we have developed comprehensive plasma metabolite signatures by using mass spectrometry to measure >200 metabolites before and after exercise. We identified plasma indicators of glycogenolysis (glucose-6-phosphate), tricarboxylic acid cycle span 2 expansion (succinate, malate, and fumarate), and lipolysis (glycerol), as well as modulators of insulin sensitivity (niacinamide) and fatty acid oxidation (pantothenic acid). Metabolites that were highly correlated with fitness parameters were found in subjects undergoing acute exercise testing and marathon running and in 302 subjects from a longitudinal cohort study. Exercise-induced increases in glycerol were strongly related to fitness levels in normal individuals and were attenuated in subjects with myocardial ischemia. A combination of metabolites that increased in plasma in response to exercise (glycerol, niacinamide, glucose-6-phosphate, pantothenate, and succinate) up-regulated the expression of nur77, a transcriptional regulator of glucose utilization and lipid metabolism genes in skeletal muscle in vitro. Plasma metabolic profiles obtained during exercise provide signatures of exercise performance and cardiovascular disease susceptibility, in addition to highlighting molecular pathways that may modulate the salutary effects of exercise.


Figures

Figure 1
Figure 1. Relative changes in metabolites in response to exercise
Heatmaps show changes in metabolites compared to baseline at the peak exercise time point (left panel) and at 60 minutes after exercise (right). Shades of red and green represent fold-increase and fold-decrease of a metabolite, respectively, relative to baseline metabolite concentrations (see color scale). Three distinct plasma samples are represented: peripheral plasma from the ETT cohort; pulmonary arterial (PA) plasma from subjects undergoing CPET; and superior vena cava (SVC) plasma from subjects undergoing CPET.
Figure 2
Figure 2. Fuel substrate mobilization during exercise
(Upper) Box-and-whisker plots indicating changes in metabolites at the peak exercise time point in ETT. The lines in the boxes indicate the median percent change in the metabolite concentrations; the lower and upper boundaries of the box represent the 25th and 75th percentiles, respectively; the lower and upper whiskers represent the 5th and 95th percentiles. (Lower) Box-and-whisker plots indicating changes in metabolites in response to prolonged exercise in the form of marathon running. AA, amino acid; G-6-P, glucose-6-phosphate; β-OH-butyrate, β-hydroxybutyrate.
Figure 3
Figure 3
(A) Enrichment of adenine nucleotide catabolites in pulmonary arterial blood during exercise. (Left) Intramuscular and extracellular metabolic reactions in the adenine nucleotide catabolism pathway. (Right) Patterns of change of individual metabolites in peripheral plasma from subjects undergoing ETT as well as pulmonary arterial (PA) and superior vena cava (SVC) plasma from subjects undergoing CPET. * P<0.05 for between group differences in metabolite levels in PA plasma vs. SVC plasma. ** P<0.05 for comparison of PA plasma metabolite levels vs. baseline. (B). Enrichment of tricarboxylic acid cycle intermediates in pulmonary arterial blood during exercise. (Right) Patterns of change in individual TCA cycle intermediates in peripheral plasma from subjects undergoing ETT as well as in pulmonary arterial (PA) and superior vena cava (SVC) plasma from subjects undergoing CPET. * P<0.05 for between group differences in metabolite levels in PA plasma vs. SVC plasma. ** P<0.05 for comparison of PA plasma metabolite levels vs. baseline
Figure 4
Figure 4. Fitness levels and differential metabolic changes during ETT
Patterns of metabolite changes in subjects who achieved higher (more fit) (solid line) and lower (less fit) (dashed line) percent predicted peak VO2 in response to exercise.
Figure 5
Figure 5. TCA intermediate changes with marathon running
(Left) Equally weighted-sums of absolute concentrations of TCA cycle intermediates (ΣTCAi, in mass spectrometry arbitrary units) (au) at baseline and upon completion of the marathon in groups of faster and slower runners (medians ± IQR). Span 1 TCA cycle intermediates include citrate/isocitrate, aconitic acid, and α - ketoglutarate. Span 2 TCA cycle intermediates include succinate, malate, and fumarate. *P=0.0001 vs. baseline. **P=0.004 between groups comparison. (Right) Relative percent changes (medians ± IQR) in metabolites from span 1 and span 2 that account for observed differences between the two groups of runners. **P=0.005 for between groups comparison.
Figure 6
Figure 6
(A) Modulation of gene expression by metabolites. (Left) mRNA expression of indicated genes (36B4: Rplp0 ribosomal protein, large, P0, HPRT: hypoxanthine guanine phosphoribosyl transferase, CYCS: cytochrome c, somatic, COX5B: cytochrome c oxidase subunit Vb, NDUFb5: NADH dehydrogenase (ubiquinone) 1 beta subcomplex, 5, NR4A1 (or nur77): nuclear receptor subfamily 4, group A, member 1, PGC1a: peroxisome proliferator-activated receptor gamma, coactivator 1 alpha, HK2: hexokinase 2, PFKM: phosphofructokinase, muscle, MCAD: acyl-Coenzyme A dehydrogenase, medium chain, CD36: fatty–acid translocase, PDK4: pyruvate dehydrogenase kinase, isoenzyme 4) in C2C12 cells differentiated into myotubes 60 minutes after treating with the metabolite cocktail (black bars) versus control (white bars). The pooled metabolites consisted of glycerol, succinate, glucose-6-phosphate, pantothenate, and niacinamide. (Right) nr4a1 in cells 0, 60, and 240 minutes after treating with cocktail. ETC, electron transport chain. TFs, transcription factors, Glyc, glycolysis; FA, fatty acid transport. *P<0.05 vs. baseline values. (B) Modulation of gene expression by exercise. (Left) mRNA expression of nr4a1 in quadriceps 0, 30, and 240 minutes after running to maximum capacity. (Right) mRNA expression of PGC-1 α (ppargc1a) and PDK4 under the same conditions.

References

    1. Thompson PD, Buchner D, Pina IL, Balady GJ, Williams MA, Marcus BH, Berra K, Blair SN, Costa F, Franklin B, Fletcher GF, Gordon NF, Pate RR, Rodriguez BL, Yancey AK, Wenger NK. Circulation. 2003;107:3109. - PubMed
    1. Gibbons RJ, Balady GJ, Bricker JT, Chaitman BR, Fletcher GF, Froelicher VF, Mark DB, McCallister BD, Mooss AN, O'Reilly MG, Winters WL, Jr., Antman EM, Alpert JS, Faxon DP, Fuster V, Gregoratos G, Hiratzka LF, Jacobs AK, Russell RO, Smith SC., Jr. Circulation. 2002;106:1883. - PubMed
    1. McNeer JF, Margolis JR, Lee KL, Kisslo JA, Peter RH, Kong Y, Behar VS, Wallace AG, McCants CB, Rosati RA. Circulation. 1978;57:64. - PubMed
    1. Myers J, Prakash M, Froelicher V, Do D, Partington S, Atwood JE. N Engl J Med. 2002;346:793. - PubMed
    1. Snader CE, Marwick TH, Pashkow FJ, Harvey SA, Thomas JD, Lauer MS. J Am Coll Cardiol. 1997;30:641. - PubMed

Publication types

Substances