

Transcriptome analysis of the hippocampal CA1 pyramidal cell region after kainic acid-induced status epilepticus in juvenile rats
- PMID: 20505763
- PMCID: PMC2873964
- DOI: 10.1371/journal.pone.0010733
Transcriptome analysis of the hippocampal CA1 pyramidal cell region after kainic acid-induced status epilepticus in juvenile rats
Abstract
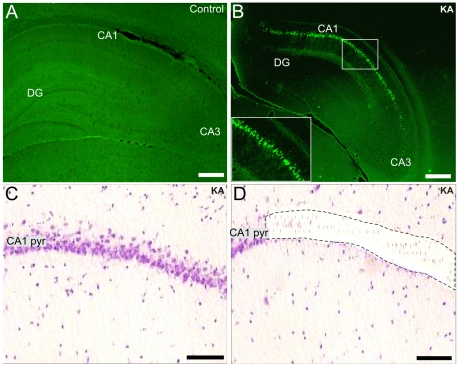
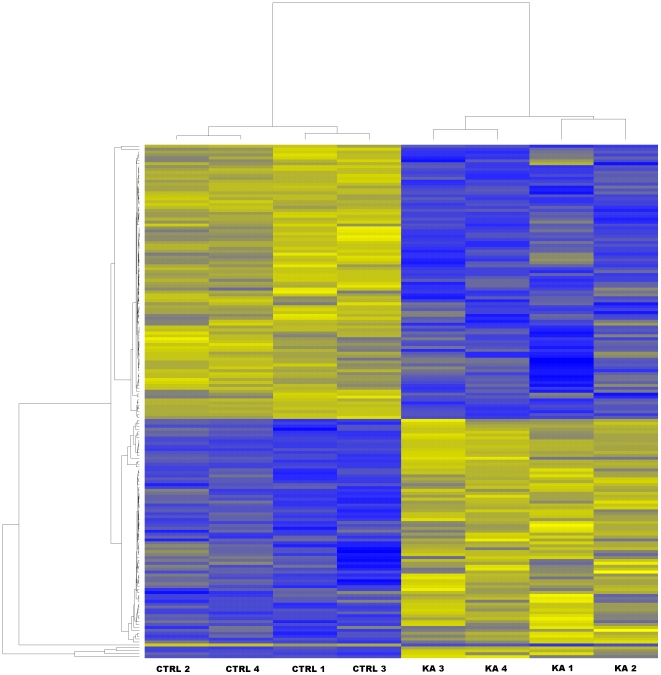
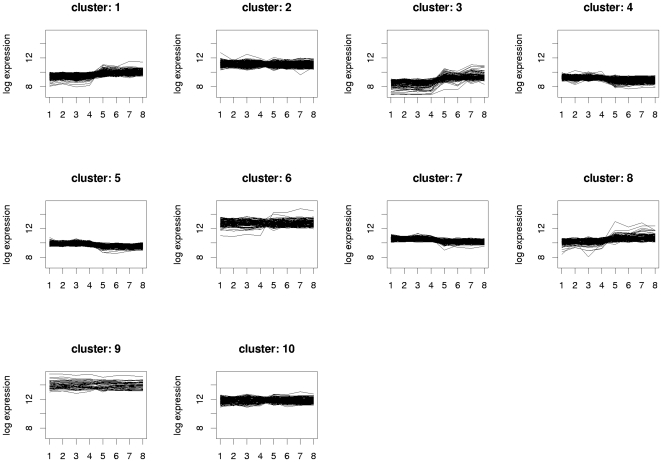
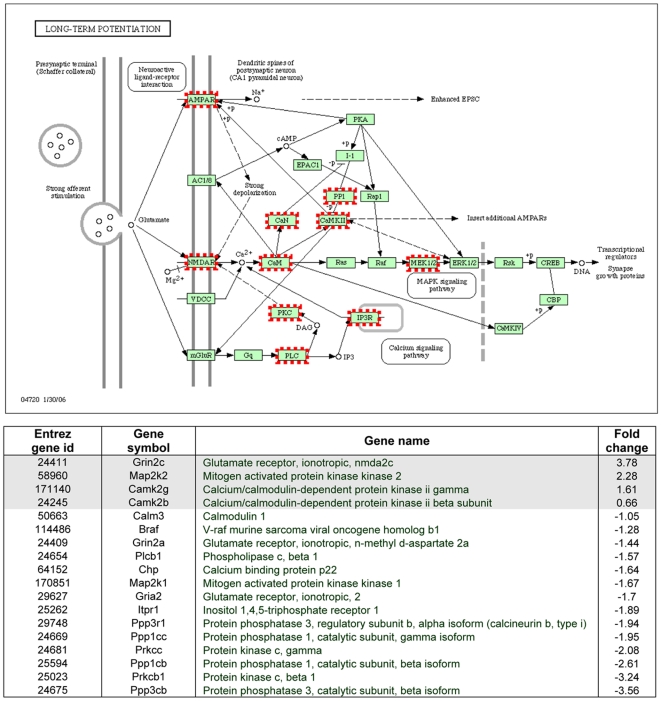
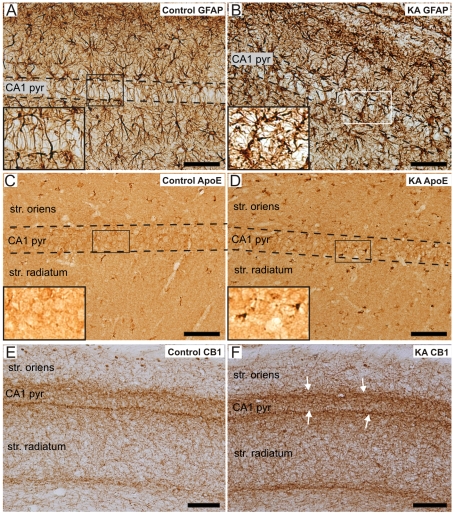
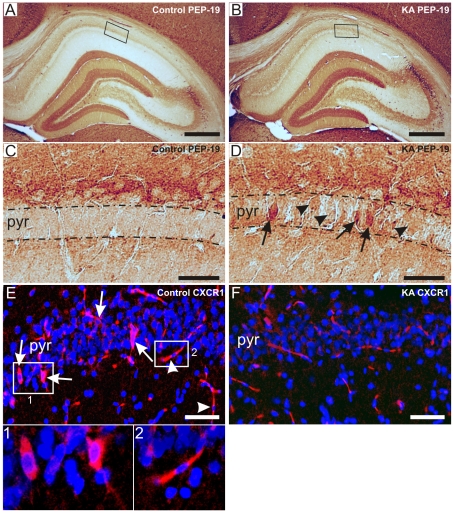
Molecular mechanisms involved in epileptogenesis in the developing brain remain poorly understood. The gene array approach could reveal some of the factors involved by allowing the identification of a broad scale of genes altered by seizures. In this study we used microarray analysis to reveal the gene expression profile of the laser microdissected hippocampal CA1 subregion one week after kainic acid (KA)-induced status epilepticus (SE) in 21-day-old rats, which are developmentally roughly comparable to juvenile children. The gene expression analysis with the Chipster software generated a total of 1592 differently expressed genes in the CA1 subregion of KA-treated rats compared to control rats. The KEGG database revealed that the identified genes were involved in pathways such as oxidative phosporylation (26 genes changed), and long-term potentiation (LTP; 18 genes changed). Also genes involved in Ca(2+) homeostasis, gliosis, inflammation, and GABAergic transmission were altered. To validate the microarray results we further examined the protein expression for a subset of selected genes, glial fibrillary protein (GFAP), apolipoprotein E (apo E), cannabinoid type 1 receptor (CB1), Purkinje cell protein 4 (PEP-19), and interleukin 8 receptor (CXCR1), with immunohistochemistry, which confirmed the transcriptome results. Our results showed that SE resulted in no obvious CA1 neuronal loss, and alterations in the expression pattern of several genes during the early epileptogenic phase were comparable to previous gene expression studies of the adult hippocampus of both experimental epileptic animals and patients with temporal lobe epilepsy (TLE). However, some changes seem to occur after SE specifically in the juvenile rat hippocampus. Insight of the SE-induced alterations in gene expression and their related pathways could give us hints for the development of new target-specific antiepileptic drugs that interfere with the progression of the disease in the juvenile age group.
Conflict of interest statement
Figures
Similar articles
-
Resistance of immature hippocampus to morphologic and physiologic alterations following status epilepticus or kindling.Hippocampus. 2001;11(6):615-25. doi: 10.1002/hipo.1076. Hippocampus. 2001. PMID: 11811655
-
Characterization of the expression of macrophage inflammatory protein-1α (MIP-1α) and C-C chemokine receptor 5 (CCR5) after kainic acid-induced status epilepticus (SE) in juvenile rats.Neuropathol Appl Neurobiol. 2012 Oct;38(6):602-16. doi: 10.1111/j.1365-2990.2012.01251.x. Neuropathol Appl Neurobiol. 2012. PMID: 22248156
-
Neuronal degeneration and gliosis time-course in the mouse hippocampal formation after pilocarpine-induced status epilepticus.Brain Res. 2012 Aug 27;1470:98-110. doi: 10.1016/j.brainres.2012.06.008. Epub 2012 Jul 8. Brain Res. 2012. PMID: 22781142
-
Antagomirs and microRNA in status epilepticus.Epilepsia. 2013 Sep;54 Suppl 6(0 6):17-9. doi: 10.1111/epi.12267. Epilepsia. 2013. PMID: 24001063 Free PMC article. Review.
-
Global expression profiling in epileptogenesis: does it add to the confusion?Brain Pathol. 2010 Jan;20(1):1-16. doi: 10.1111/j.1750-3639.2008.00254.x. Epub 2009 Feb 24. Brain Pathol. 2010. PMID: 19243383 Free PMC article. Review.
Cited by
-
Clinical studies and anti-inflammatory mechanisms of treatments.Epilepsia. 2017 Jul;58 Suppl 3(Suppl 3):69-82. doi: 10.1111/epi.13779. Epilepsia. 2017. PMID: 28675558 Free PMC article.
-
Using Postmortem hippocampi tissue can interfere with differential gene expression analysis of the epileptogenic process.PLoS One. 2017 Aug 4;12(8):e0182765. doi: 10.1371/journal.pone.0182765. eCollection 2017. PLoS One. 2017. PMID: 28783762 Free PMC article.
-
Identifying targets for preventing epilepsy using systems biology.Neurosci Lett. 2011 Jun 27;497(3):205-12. doi: 10.1016/j.neulet.2011.02.041. Epub 2011 Mar 4. Neurosci Lett. 2011. PMID: 21382442 Free PMC article. Review.
-
Glial responses during epileptogenesis in Mus musculus point to potential therapeutic targets.PLoS One. 2018 Aug 16;13(8):e0201742. doi: 10.1371/journal.pone.0201742. eCollection 2018. PLoS One. 2018. PMID: 30114263 Free PMC article.
-
Role of signal transducer and activator of transcription-3 in up-regulation of GFAP after epilepsy.Neurochem Res. 2011 Dec;36(12):2208-15. doi: 10.1007/s11064-011-0576-1. Epub 2011 Aug 11. Neurochem Res. 2011. PMID: 21833841
References
-
- Pitkänen A, Sutula TP. Is epilepsy a progressive disorder? Prospects for new therapeutic approaches in temporal-lobe epilepsy. Lancet Neurol. 2002;1:173–181. - PubMed
-
- Sander JW. The epidemiology of epilepsy revisited. Curr Opin Neurol. 2003;16:165–170. - PubMed
-
- Sperk G, Lassmann H, Baran H, Kish SJ, Seitelberger F, et al. Kainic acid induced seizures: neurochemical and histopathological changes. Neuroscience. 1983;10:1301–1315. - PubMed
-
- Ben-Ari Y. Limbic seizure and brain damage produced by kainic acid: mechanisms and relevance to human temporal lobe epilepsy. Neuroscience. 1985;14:375–403. - PubMed
-
- Covolan L, Mello LE. Temporal profile of neuronal injury following pilocarpine or kainic acid-induced status epilepticus. Epilepsy Res. 2000;39:133–152. - PubMed
Publication types
MeSH terms
Substances
LinkOut - more resources
Full Text Sources
Other Literature Sources
Miscellaneous
