. 2010 Jul;19(7):1296-311.
doi: 10.1002/pro.406.

Sequence and structure continuity of evolutionary importance improves protein functional site discovery and annotation

Affiliations

Sequence and structure continuity of evolutionary importance improves protein functional site discovery and annotation

A D Wilkins et al. Protein Sci. 2010 Jul.

Abstract

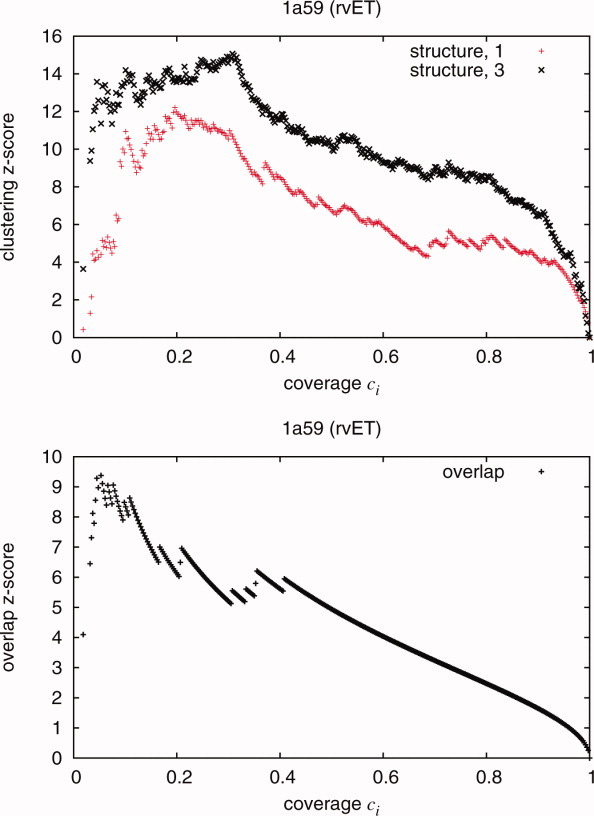
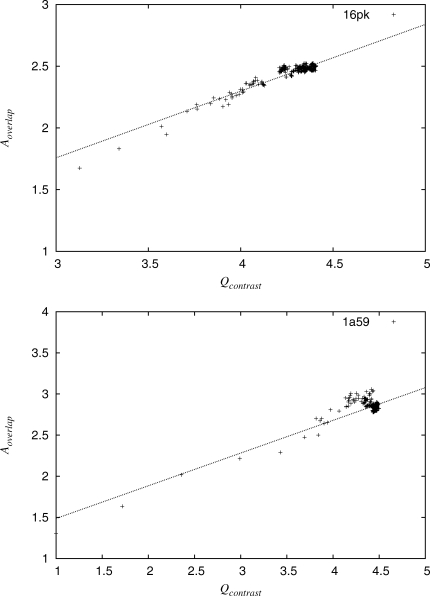
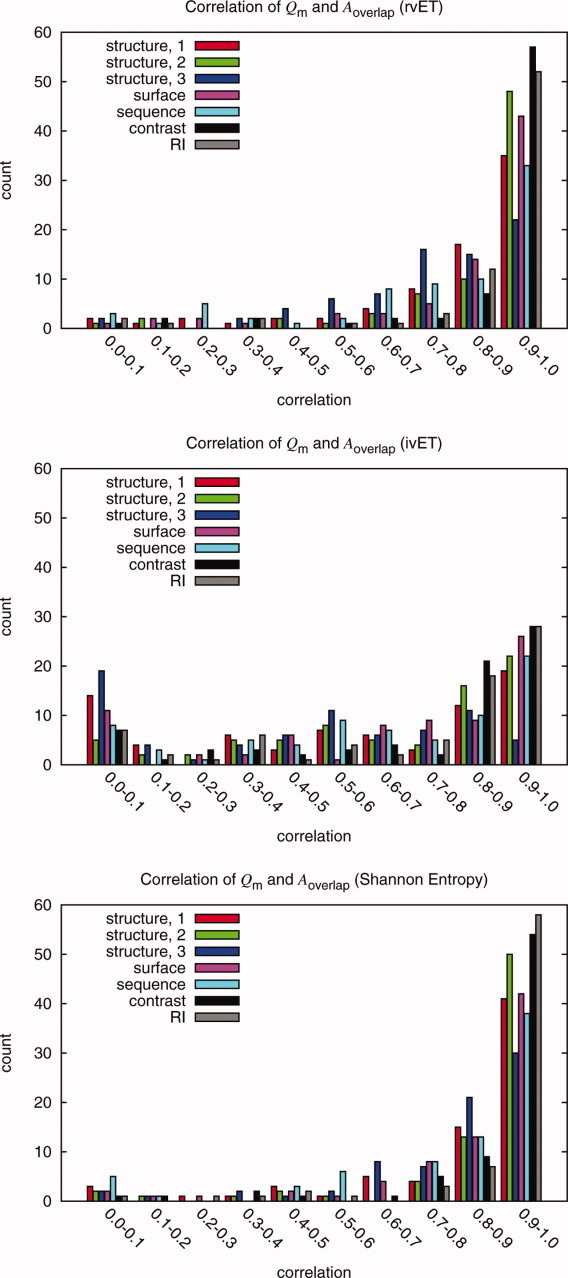
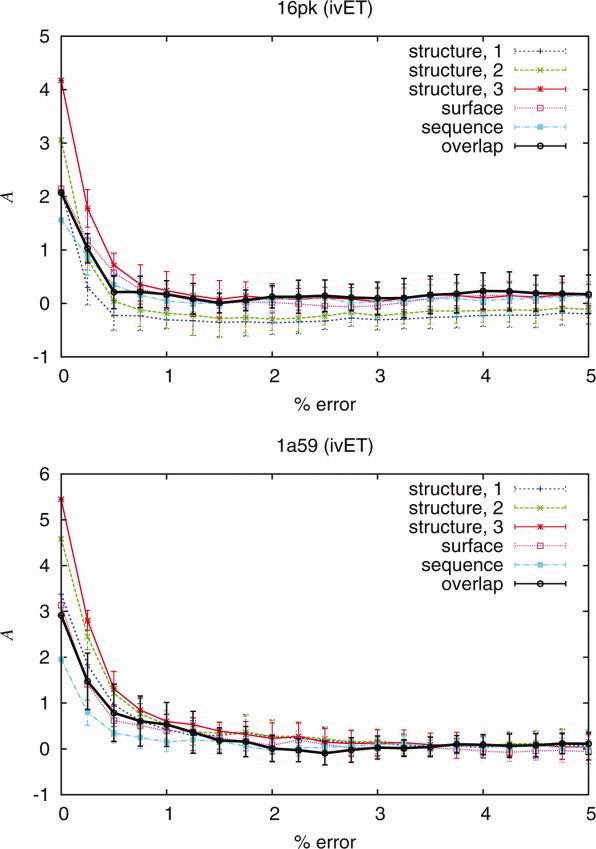
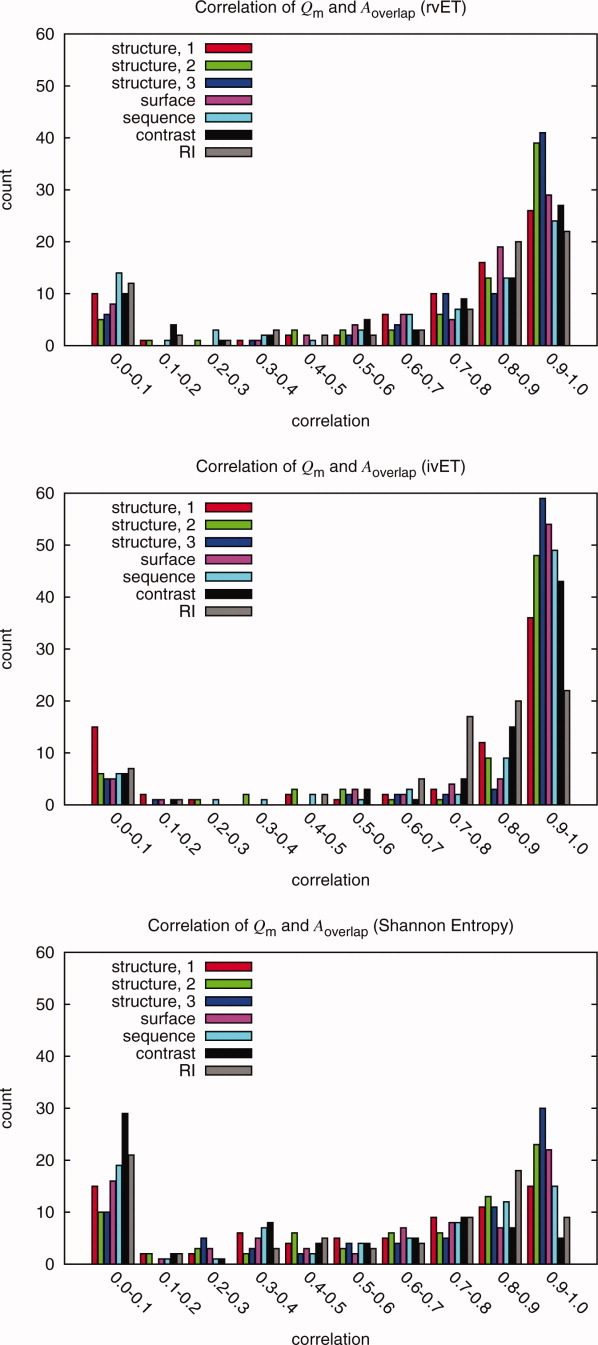
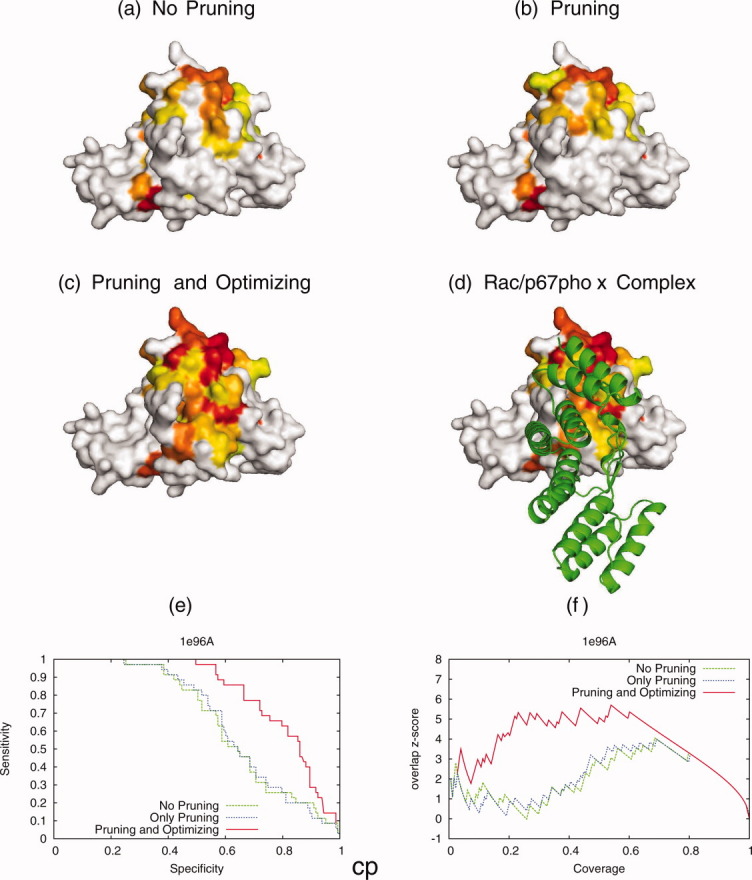
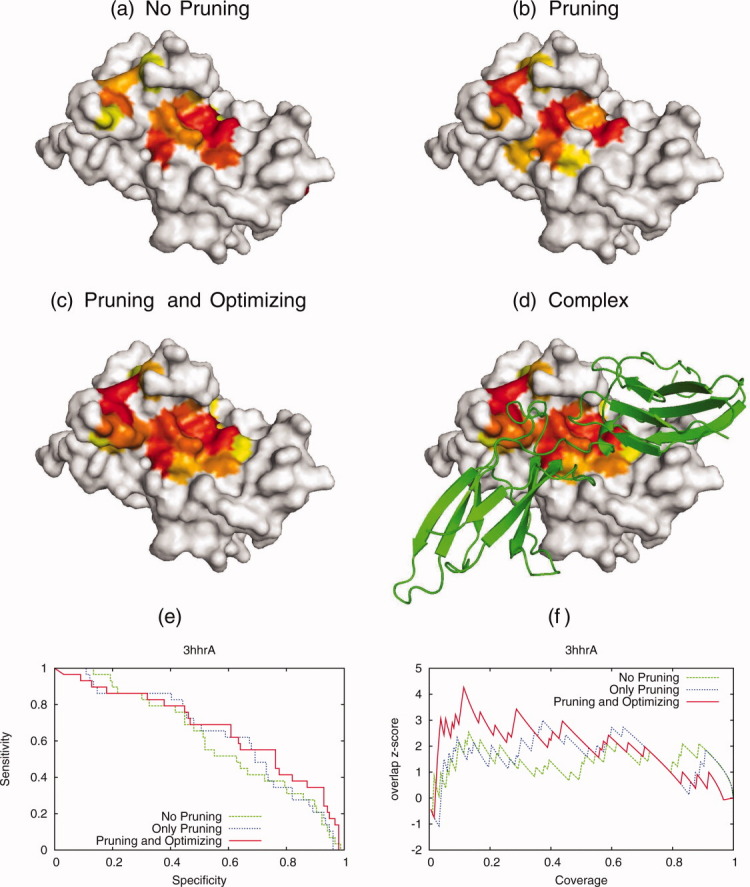
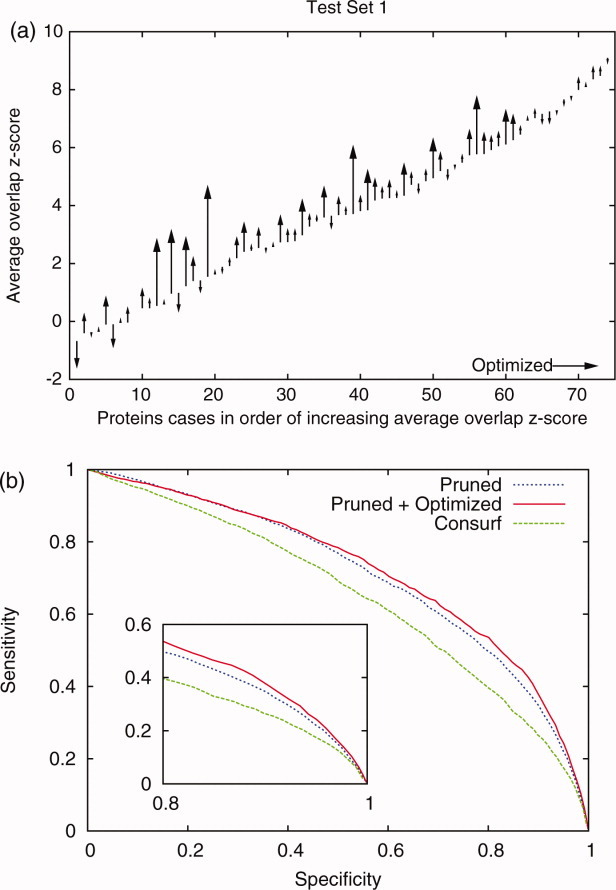
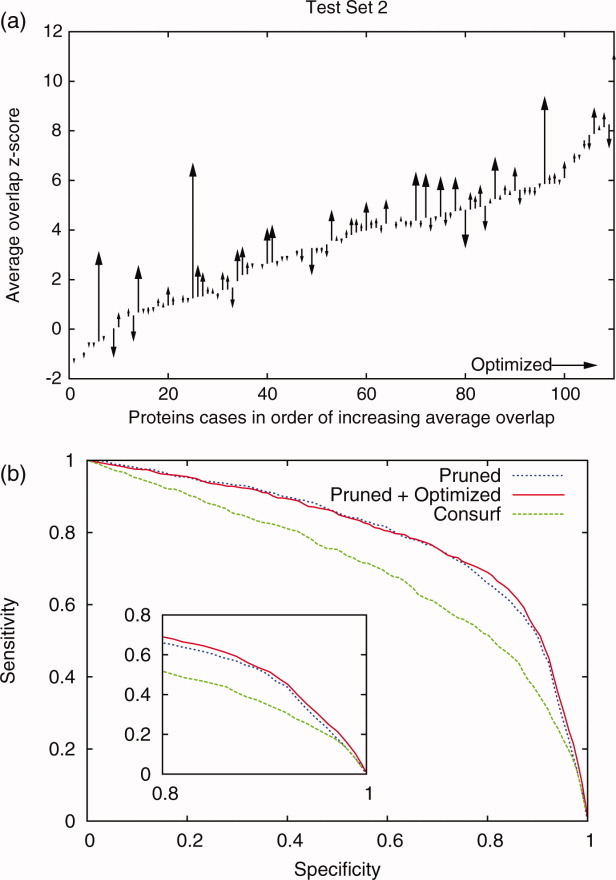
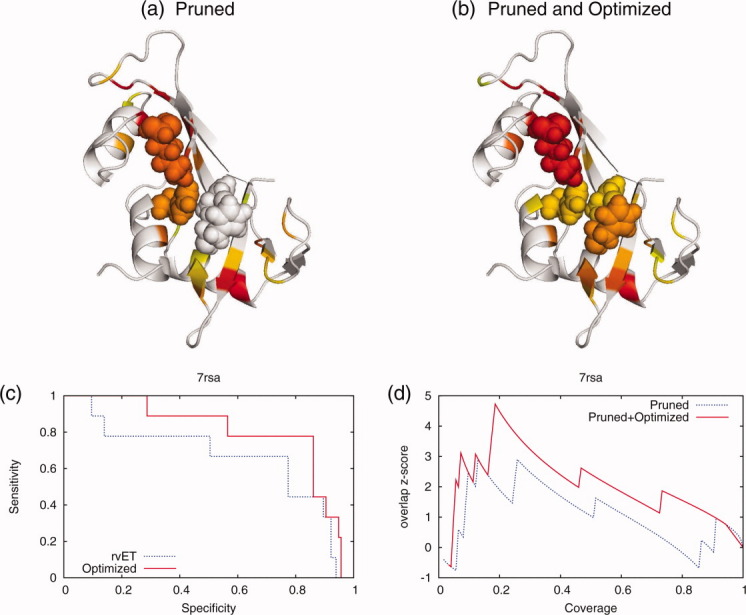
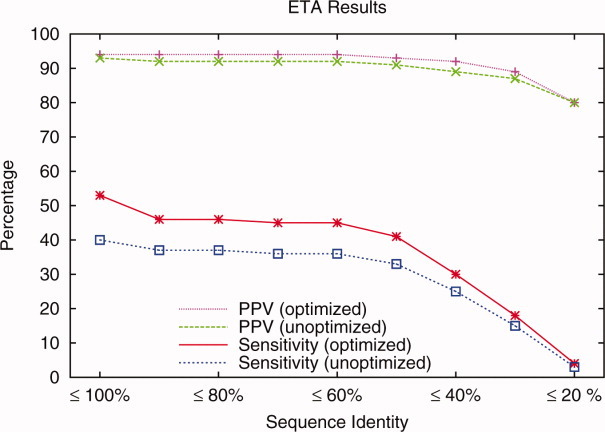
Protein functional sites control most biological processes and are important targets for drug design and protein engineering. To characterize them, the evolutionary trace (ET) ranks the relative importance of residues according to their evolutionary variations. Generally, top-ranked residues cluster spatially to define evolutionary hotspots that predict functional sites in structures. Here, various functions that measure the physical continuity of ET ranks among neighboring residues in the structure, or in the sequence, are shown to inform sequence selection and to improve functional site resolution. This is shown first, in 110 proteins, for which the overlap between top-ranked residues and actual functional sites rose by 8% in significance. Then, on a structural proteomic scale, optimized ET led to better 3D structure-function motifs (3D templates) and, in turn, to enzyme function prediction by the Evolutionary Trace Annotation (ETA) method with better sensitivity of (40% to 53%) and positive predictive value (93% to 94%). This suggests that the similarity of evolutionary importance among neighboring residues in the sequence and in the structure is a universal feature of protein evolution. In practice, this yields a tool for optimizing sequence selections for comparative analysis and, via ET, for better predictions of functional site and function. This should prove useful for the efficient mutational redesign of protein function and for pharmaceutical targeting.


Figures

Figure 1
Figure 1
(a) The clustering z-score measures the nonrandomness of the clustering of top-ranked residues in space. The z-scores are a direct result of the ranking of the residues in a protein structure. This diagram shows an example of the clustering z-scores as a function of ci using the rvET method for a cold-active citrate synthase [Antarctic bacterium, PDB 1a59]. The high clustering z-scores would indicate similarly ranked residues proximate in the structure and would be considered a positive result. Quality measures Qstructure,1 and Qstructure,3 are variants of the clustering z-scores. (b) To represent a method's ability to predict a known site, the overlap z-score is also calculated using a simple hypergeometric distribution. An example of the overlap z-scores as a function of ci can be seen in bottom figure. The overlap measure Aoverlap is derived from the these z-scores.
Figure 2
Figure 2
A correlation between quality measures and overlap of known site was found when variations were considered in alignment. The quality measures are a result of the ranking of the sequences in an alignment. These diagrams show examples of the values of quality measure Qcontrast and overlap measure Aoverlap as sequences are added into the analysis randomly. The values for the first 30 sequences added to the analysis were used to calculate correlation.
Figure 3
Figure 3
Distribution of Pearson correlations between quality measure variations and overlap measure variations in 74 proteins when sequences are added randomly added to an alignment. The purpose of the study was to test the methods and quality measures as a function of sequence selection. The histograms show the correlations of the possible quality measures and functional site measure Aoverlap for the rvET, ivET, and Shannon Entropy method when 30 sequences are randomly added to the ranking analysis. The Qcontrast (labeled EC), QRI and Qstructure,2 had the highest correlations amongst the quality measures for the ranking methods though all measures where found to have some correlation. Note that one method, ivET, had more proteins with little or no correlation. This is consistent with the high sensitivity of ivET to errors, gaps, misalignments or polymorphisms that break a perfect match between sequence variations and phylogenetic divergences. Once such a sequence was added to the input, it decreased the overlap to a known site irretrievably, yielding traces with lower quality and lower correlation.
Figure 4
Figure 4
Analysis was performed to study the performance of the quality measures and the ranking methods as errors were introduced. The deterioration of the quality measures and overlap measure Aoverlap as a function of random mutations in the analysis is observed in protein 16pk and 1a59. Correlation was determined from the values of the quality measures and overlap measure Aoverlap.
Figure 5
Figure 5
To test ranking methods and quality measures, random mutations were inserted into the alignment. These histograms show the correlations of the possible quality measures and functional site measure Aoverlap for the rvET, ivET, and Shannon Entropy method. The Qstructure,2 and Qstructure,3 measures consistently have the best correlations in all three methods for the majority of the proteins. All measures were shown to have some correlation. The Shannon Entropy and the rvET methods had a significant number of proteins with low correlation when compared to the ivET method. This is because ivET is very sensitive to errors while the other methods are more resilient. Thus, as errors were added, ivET rapidly lost accuracy and showed better correlations than the two other, more robust methods for which the overlap with the known site would not change dramatically up until the alignment had 20% error. Though this decreased correlation may impair optimization, it is desirable for good initial functional site prediction.
Figure 6
Figure 6
The sequence selection was optimized with quality measure Qcontrast for human Rac/p67phox complex [PDB 1e96]. The top 25% ranked residues before and after the optimization are shown here. The individual rankings with no pruning (a), only pruning (b) and after optimization (c) are shown. (d) shows the actual protein–protein interface. The bound protein p67phox is shown in green. Before optimization the average overlap z-score 〈zo〉 after pruning is 0.96 while the optimization improves 〈zo〉 to 2.76. The new alignment predicts more residues proximate to the known protein-protein interface. The optimization of the sequence selection dramatically improves the ability to predict the interfaces. An interactive view is available in the electronic version of the article.
Figure 7
Figure 7
The optimization was performed with the Qsurface quality measure for the human growth hormone and receptor complex [PDB 3hhr]. The individual rankings with no pruning (a), only pruning (b) and after optimization (c) are shown (Red is most important and yellow is 25th percentile rank). The new selection of sequences enables the ranking method to recover the protein–protein interface with the receptor (shown in green). The average overlap z-scores starts 〈zo〉 = 1.30 (no pruning), after pruning 〈zo〉 is 1.48 and after quality measure optimization the 〈zo〉 = 3.14. The new sequence selection improves the ability to the predict the protein interface.
Figure 8
Figure 8
Optimization of the sequence selection using the combined quality measure further improved functional site prediction. Best results were obtained by first pruning the alignment and then followed by quality measure optimization with a combination of the standard score of the quality measures, Qsurface, Qstructure,2, Qsequence, and Qcontrast. (a) The diagram shows the functional site measure 〈zo〉 before and after the optimization of the pruned alignments is compared for the 74 individual proteins. The average overlap z-scores increased by 12% when rankings depend the optimized alignments compared to the pruned only. (b) The differences in methods can also be seen in receiver-operator curve. The pruned traces and pruned/optimized out performed the Consurf results.
Figure 9
Figure 9
To test quality measure optimization method a second set was optimized for improvement in site prediction. The average z-score before and after the optimization for the 110 proteins was compared. (a) We found that after optimized sequence selection the dataset improved site prediction (average z-score improved from 3.46 to 3.75, an 8% increase). (b) The pruned traces and pruned/optimized out performed the Consurf results.
Figure 10
Figure 10
The example of the optimized sequence selection for phosphate-free bovine ribonuclease [PDB 7rsa] known to have an active site with catalytic residues. The top 20% ranked residues before (a) and after the optimization (b) are shown in both diagram. Residues marked red are most important and yellow are the 20th percentile rank. The overlap z-scores (c) and sensitivity/specifity (d) had significant improvement with a new selection of sequences based on quality measures.
Figure 11
Figure 11
ETAs performance for 1217 enzymes with optimized and unoptimized ET. Positive predictive value (PPV) and sensitivity are calculated removing matches above a sequence identity threshold.
Figure 12
Figure 12
Pictures show the ETA templates as spheres on the PDB 2grj (chain A) structure. Both templates are taken at 5.14% ET percentile rank. Left structure (a) shows the template from unoptimized ET while the right (b) is the template from quality measure optimized ET.

References

    1. Lee D, Redfern O, Orengo C. Predicting protein function from sequence and structure. Nat Rev Mol Cell Biol. 2007;8:995–1005. - PubMed
    1. Laskowski RA, Thornton JM. Understanding the molecular machinery of genetics through 3D structures. Nat Rev Genet. 2008;9:141–145. - PubMed
    1. Jiang L, Althoff EA, Clemente FR, Doyle L, Röthlisberger D, Zanghellini A, Gallaher JL, Betker JL, Tanaka F, Barbas CF, Hilvert D, Houk KN, Stoddard BL, Baker D. De novo computational design of retro-aldol enzymes. Science. 2008;319:1387–1391. - PMC - PubMed
    1. Thyme SB, Jarjour J, Takeuchi R, Havranek JJ, Ashworth J, Scharenberg AM, Stoddard BL, Baker D. Exploitation of binding energy for catalysis and design. Nature. 2009;461:1300–1304. - PMC - PubMed
    1. Hardy JA, Wells J. Searching for new allosteric sites in enzymes. Curr Opin Struct Biol. 2004;14:706–715. - PubMed

Publication types

LinkOut - more resources