. 2010 Jul;28(7):1186-95.
doi: 10.1002/stem.437.

Hematopoietic stem cell defects in mice with deficiency of Fancd2 or Usp1

Affiliations

Hematopoietic stem cell defects in mice with deficiency of Fancd2 or Usp1

Kalindi Parmar et al. Stem Cells. 2010 Jul.

Abstract

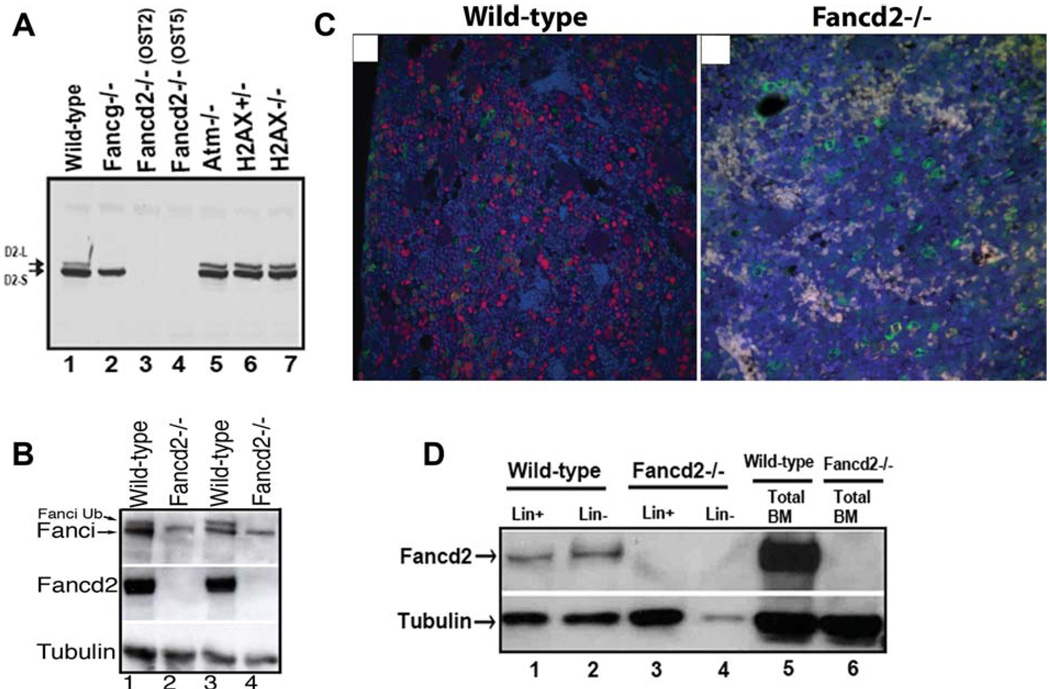
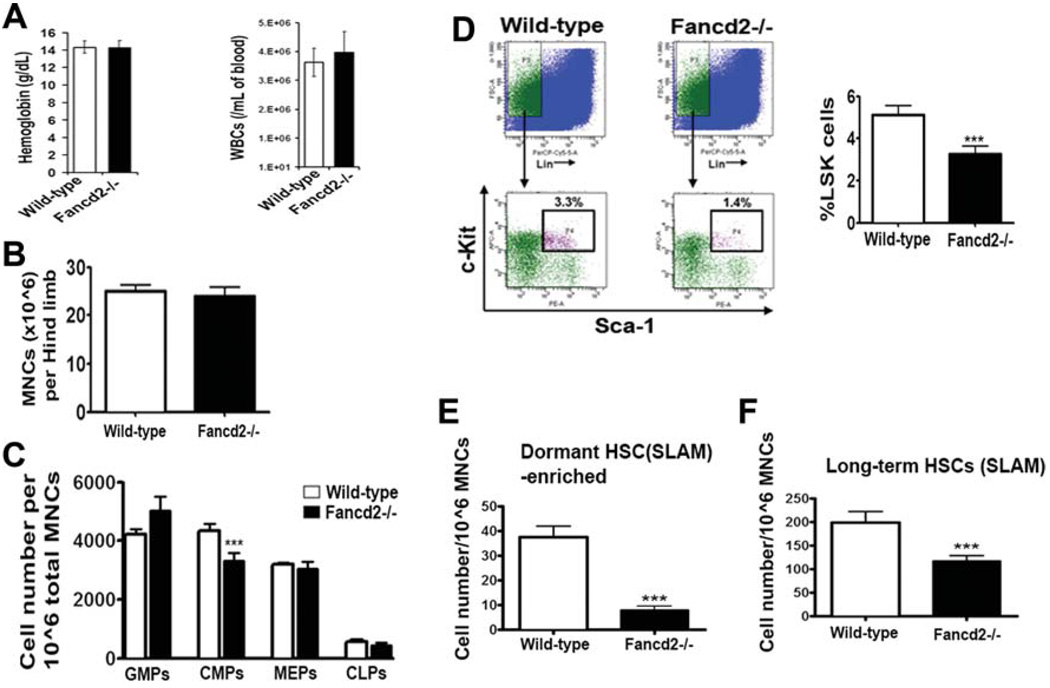
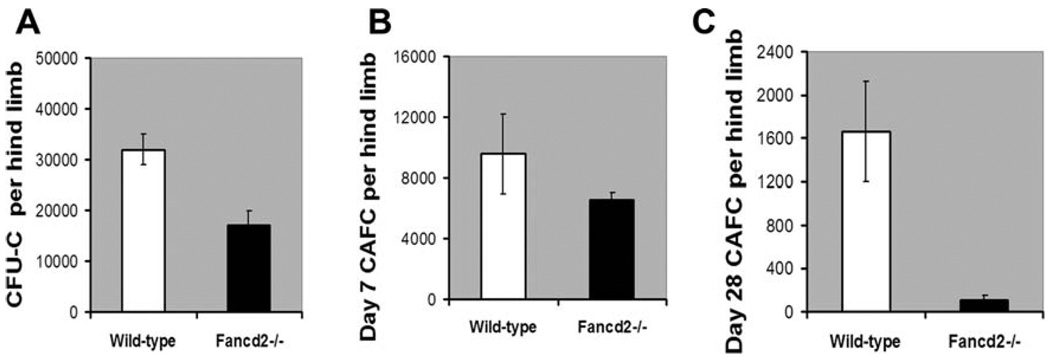
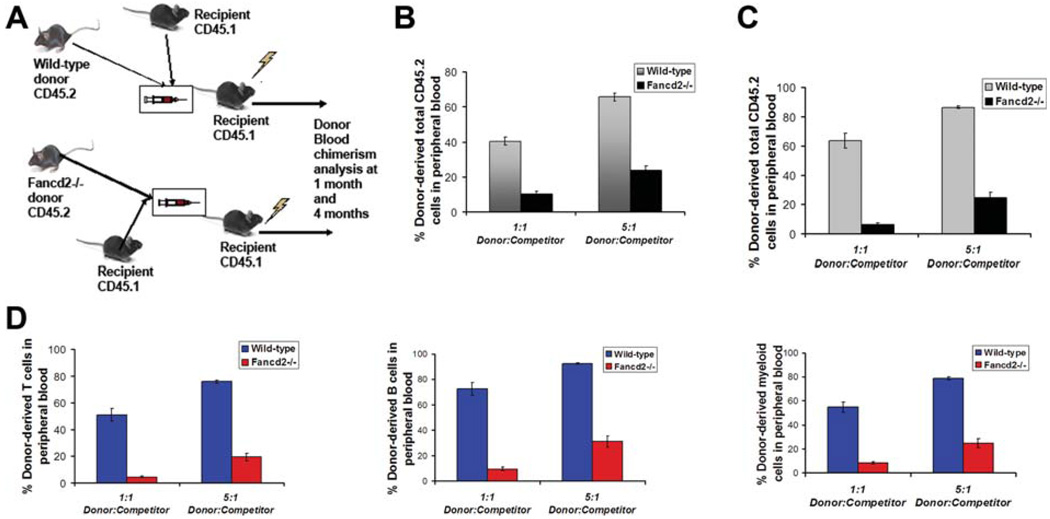
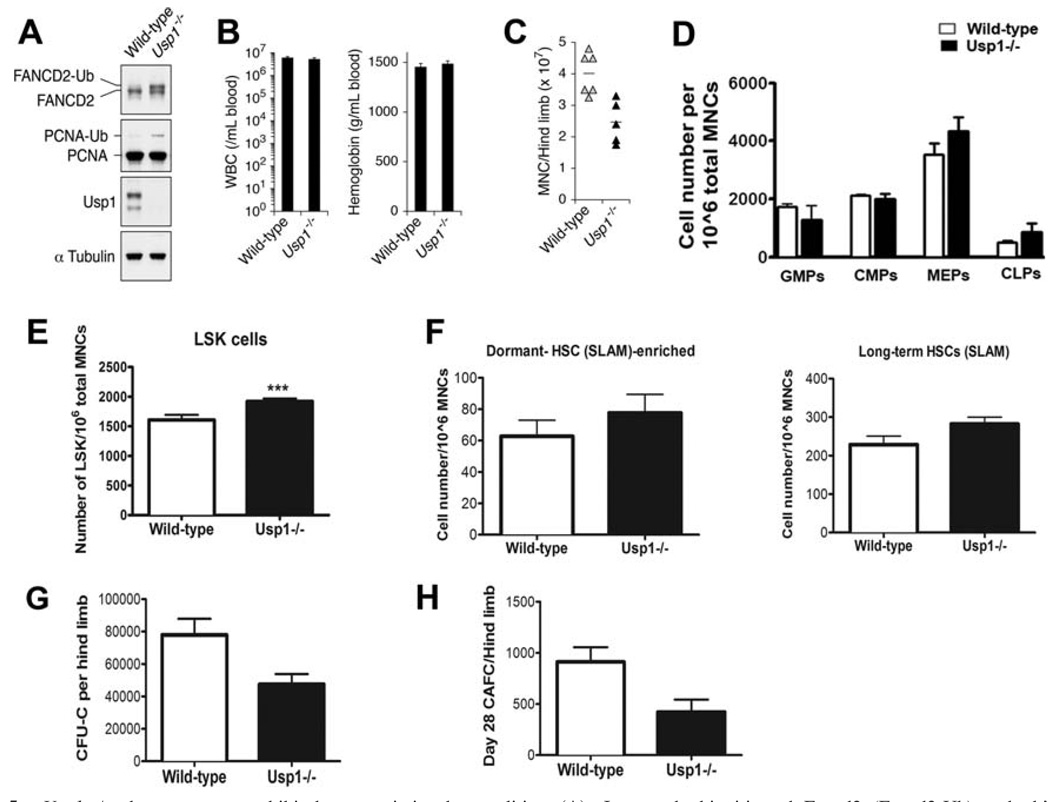
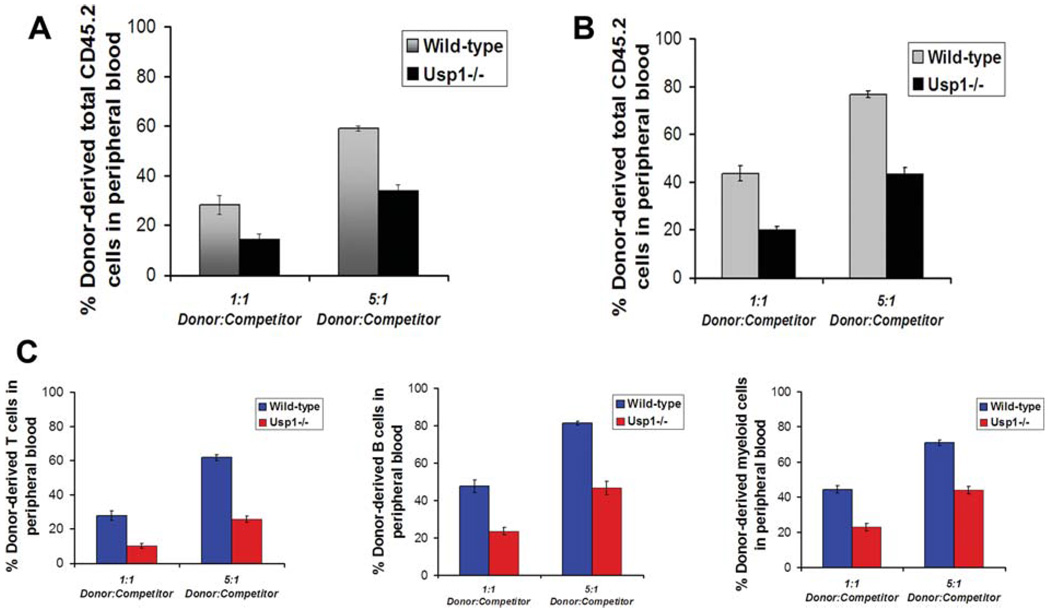
Fanconi anemia (FA) is a human genetic disease characterized by a DNA repair defect and progressive bone marrow failure. Central events in the FA pathway are the monoubiquitination of the Fancd2 protein and the removal of ubiquitin by the deubiquitinating enzyme, Usp1. Here, we have investigated the role of Fancd2 and Usp1 in the maintenance and function of murine hematopoietic stem cells (HSCs). Bone marrow from Fancd2-/- mice and Usp1-/- mice exhibited marked hematopoietic defects. A decreased frequency of the HSC populations including Lin-Sca-1+Kit+ cells and cells enriched for dormant HSCs expressing signaling lymphocyte activation molecule (SLAM) markers, was observed in the bone marrow of Fancd2-deficient mice. In addition, bone marrow from Fancd2-/- mice contained significantly reduced frequencies of late-developing cobblestone area-forming cell activity in vitro compared to the bone marrow from wild-type mice. Furthermore, Fancd2-deficient and Usp1-deficient bone marrow had defective long-term in vivo repopulating ability. Collectively, our data reveal novel functions of Fancd2 and Usp1 in maintaining the bone marrow HSC compartment and suggest that FA pathway disruption may account for bone marrow failure in FA patients.


Conflict of interest statement

DISCLOSURE OF POTENTIAL CONFLICTS OF INTEREST

The authors indicate no potential conflicts of interest.

Figures

Figure 1
Figure 1
Fancd2 expression in murine tissues. (A): Western blot of Fancd2 in splenocytes with indicated genotypes. Note that Fancd2 protein expression is deficient in both OST2 and OST5 mouse lines (lanes 3, 4). (B): Western blot of Fanci and Fancd2 in bone marrow cells from four different mice with indicated genotypes. (C): Detection of Fancd2 in the bone marrow in the bone sections using the HistoRX fluorescence imaging system. Representative examples of fluorescent staining for Fancd2 (red) and myeloperoxidase (green) on wild-type and Fancd2−/− paraffin embedded bone sections are shown. DAPI stain (blue) highlights the total nuclei. Note that Fancd2 staining (red) is observed in subset of the myeloperoxidase stained myeloid cells (green) as well as in the myeloperoxidase negative cells in the wild-type bone marrow. Magnification ×400. (D): Western blot of Fancd2 in fractionated Lin+ and Lin− BM cells from wild-type and Fancd2−/− mice. Abbreviations: BM, bone marrow; Lin−, lineage negative; Lin+, lineage positive.
Figure 2
Figure 2
Bone marrow from Fancd2−/− mice exhibit abnormalities in the size of progenitor and stem cell compartments. (A): Peripheral blood WBC counts and hemoglobin levels in wild-type and Fancd2−/− mice (n = 5 per group). (B): Bone marrow cellularity in wild-type and Fancd2−/− mice (n = 8 for wild-type and n = 13 for Fancd2−/−). (C): Number of myeloid progenitors (GMPs, CMPs, MEPs) and lymphoid progenitors (CLPs) in the bone marrow of wild-type and Fancd2−/− mice (n = 3 per group). (D): Reduced frequencies of HSCs in the Fancd2−/− bone marrow. The left panel shows an example of a flow cytometric plot of Sca-1 and c-Kit staining of lineage negative bone marrow. The right panel shows frequencies of Lin-Sca1+c-Kit+ (LSK) cells in the bone marrow ((n = 11 for wild-type and n = 16 for Fancd2−/−). (E): Number of cells enriched for dormant HSCs expressing SLAM code (Lin lowSca1+c-Kit+CD150+CD48−CD34− cells) in wild-type and Fancd2−/− bone marrow (n = 3 per group). (F): Number of long-term HSCs expressing SLAM code (Lin lowSca1+c-Kit+CD150+CD48−cells) in wild-type and Fancd2−/− bone marrow (n = 3 per group). Error bars represent SEM in all the panels. Asterisks represent data with statistically significant difference compared to the wild-type with p values < .05. Abbreviations: CLP, common lymphoid progenitors; CMP, common myeloid progenitors; GMP, granulocyte/macrophage progenitor; HSC, hematopoietic stem cell; MEP, megakaryocyte/erythrocyte progenitor; MNC, mononuclear cells; SLAM, signaling lymphocyte activation molecule; WBC, white blood cells.
Figure 3
Figure 3
Fancd2-deficient bone marrow contains reduced functional hematopoietic activity. (A, B) Decreased progenitor activity (CFU-C and day 7 CAFC) in the Fancd2−/− bone marrow compared to the wild-type bone marrow. (C): Significant reduction in the primitive HSC activity (day 28 CAFC) in the bone marrow of Fancd2−/− mice compared to the bone marrow of wild-type mice. Data in all the plots are average from n = 4 Wild-type mice and n = 4 Fancd2−/− mice. Error bars indicate SEM. The p values for the difference between wild-type and Fancd2−/− groups in the plots A, B, and C were 0.005, 0.172, and 0.022, respectively. Abbreviations: CAFC, cobblestone area-forming cell; CFU-C, colony-forming units in culture.
Figure 4
Figure 4
Bone marrow cells from Fancd2−/− mice show reduced long-term repopulating potential in vivo. (A): Schematic of the competitive bone marrow transplantation strategy. (B): Donor cell engraftment (total leukocytes) at 4 weeks in peripheral blood of recipients transplanted with wild-type or Fancd2−/− donor bone marrow. (C): Donor cell engraftment (total leukocytes) at 16 weeks in peripheral blood of recipients transplanted with wild-type or Fancd2−/− bone marrow. (D): Donor-derived T-cell engraftment (left panel), B cell engraftment (middle panel), and myeloid cell engraftment (right panel) at 16 weeks in peripheral blood of recipients transplanted with wild-type or Fancd2−/− bone marrow. Data in all the plots are average from 15 recipients (n = 3 donor wild-type or Fancd2−/− mice in each group, n = 5 recipient mice per donor sample). Error bars represent SEM. The p values for the statistical difference between the wild-type and Fancd2−/− mice are highly significant (p < .0005).
Figure 5
Figure 5
Usp1−/− bone marrow exhibit hematopoietic abnormalities. (A): Increased ubiquitinated Fancd2 (Fancd2-Ub) and ubiquitinted PCNA (PCNA-Ub) in the bone marrow of Usp1-deficient mice. Western blots of bone marrow lysates from wild-type and Usp1−/− mice immunoblotted with indicated antibodies are shown. (B): Normal blood counts and hemoglobin levels in Usp1−/− mice. (C): Decreased bone marrow cellularity in Usp1−/− mice. (D): Number of myeloid progenitors (GMPs, CMPs, MEPs) and lymphoid progenitors (CLPs) in the bone marrow from wild-type and Usp1−/− mice. (E): Number of HSCs (Lin-Sca1+c-Kit+ (LSK) cells) in the bone marrow from wild-type and Usp1−/− mice. (F): Number of long-term HSCs expressing SLAM code (Lin lowSca1+c-Kit+CD150+CD48− cells; right panel) and cells enriched for dormant HSCs expressing SLAM code (Lin lowSca1+c-Kit+CD150+CD48−CD34− cells; left panel) in wild-type and Usp1−/− bone marrow. (G): Reduced CFU-C activity of the bone marrow from Usp1−/− mice. (H): Decreased hematopoietic stem cell activity (day 28 CAFC) of the bone marrow from Usp1−/− mice. Data are average from at least three mice per group in all the panels. Error bars indicate SEM. Asterisks represent data with statistically significant difference compared to the wild-type with p values < .05. CFU-C, colony-forming units in culture; CAFC, cobblestone area-forming cell; CLP, common lymphoid progenitor; CMP, common myeloid progenitors; GMP, granulocyte/macrophage progenitor; HSC, hematopoietic stem cell; LSK, Lineage-Sca-1+c-Kit+; MNC, mononuclear cells; MEP, megakaryocyte/erythrocyte progenitor; PCNA, proliferating cell nuclear antigen; SLAM, signaling lymphocyte activation molecule; WBC, white blood cells.
Figure 6
Figure 6
Bone marrow cells from Usp1−/− mice show reduced long-term repopulating potential in vivo. (A): Donor cell engraftment (total leukocytes) at 4 weeks in peripheral blood of recipients transplanted with wild-type or Usp1−/− bone marrow. (B): Donor cell engraftment (total leukocytes) at 16 weeks in peripheral blood of recipients transplanted with wild-type or Usp1−/− bone marrow. (C): Donor-derived T-cell engraftment (left panel), B cell engraftment (middle panel), and myeloid cell engraftment (right panel) at 16 weeks in peripheral blood of recipients transplanted with wild-type or Usp1−/− bone marrow. Data in all the plots are average from 15 recipients (n = 3 donor wild-type or Usp1−/− mice in each group, n = 5 recipient mice per donor sample). Error bars indicate SEM. The p values for the statistical difference between the wild-type and Usp1−/− mice are highly significant (p < .0005).

References

    1. D’Andrea AD, Grompe M. The Fanconi anaemia/BRCA pathway. Nat Rev Cancer. 2003;3:23–34. - PubMed
    1. Joenje H, Patel KJ. The emerging genetic and molecular basis of Fanconi anaemia. Nat Rev Genet. 2001;2:446–457. - PubMed
    1. Auerbach AD, Rogatko A, Schroeder-Kurth TM. International Fanconi Anemia Registry: Relation of clinical symptoms to diepoxybutane sensitivity. Blood. 1989;73:391–396. - PubMed
    1. Wang W. Emergence of a DNA-damage response network consisting of Fanconi anaemia and BRCA proteins. Nat Rev Genet. 2007;8:735–748. - PubMed
    1. Rosenberg PS, Greene MH, Alter BP. Cancer incidence in persons with Fanconi anemia. Blood 1. 2003;101:822–826. - PubMed

Publication types

MeSH terms