

Epigenomic diversity of colorectal cancer indicated by LINE-1 methylation in a database of 869 tumors
- PMID: 20507599
- PMCID: PMC2892454
- DOI: 10.1186/1476-4598-9-125
Epigenomic diversity of colorectal cancer indicated by LINE-1 methylation in a database of 869 tumors
Abstract
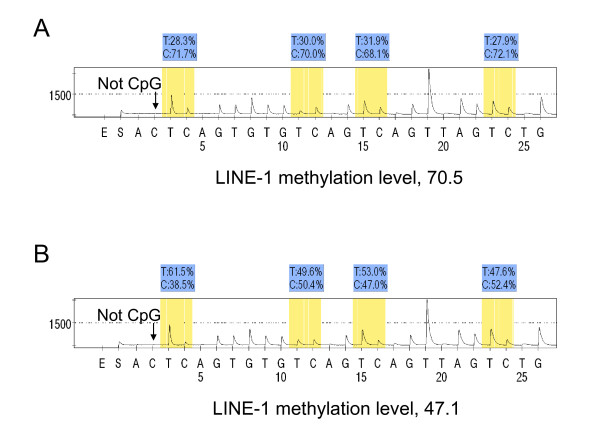
Background: Genome-wide DNA hypomethylation plays a role in genomic instability and carcinogenesis. LINE-1 (L1 retrotransposon) constitutes a substantial portion of the human genome, and LINE-1 methylation correlates with global DNA methylation status. LINE-1 hypomethylation in colon cancer has been strongly associated with poor prognosis. However, whether LINE-1 hypomethylators constitute a distinct cancer subtype remains uncertain. Recent evidence for concordant LINE-1 hypomethylation within synchronous colorectal cancer pairs suggests the presence of a non-stochastic mechanism influencing tumor LINE-1 methylation level. Thus, it is of particular interest to examine whether its wide variation can be attributed to clinical, pathologic or molecular features.
Design: Utilizing a database of 869 colorectal cancers in two prospective cohort studies, we constructed multivariate linear and logistic regression models for LINE-1 methylation (quantified by Pyrosequencing). Variables included age, sex, body mass index, family history of colorectal cancer, smoking status, tumor location, stage, grade, mucinous component, signet ring cells, tumor infiltrating lymphocytes, CpG island methylator phenotype (CIMP), microsatellite instability, expression of TP53 (p53), CDKN1A (p21), CTNNB1 (beta-catenin), PTGS2 (cyclooxygenase-2), and FASN, and mutations in KRAS, BRAF, and PIK3CA.
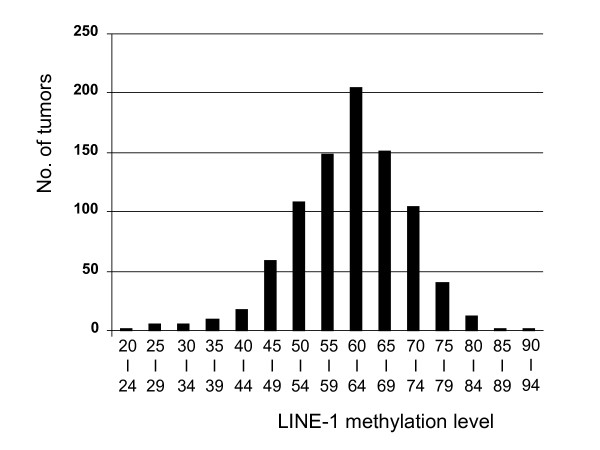
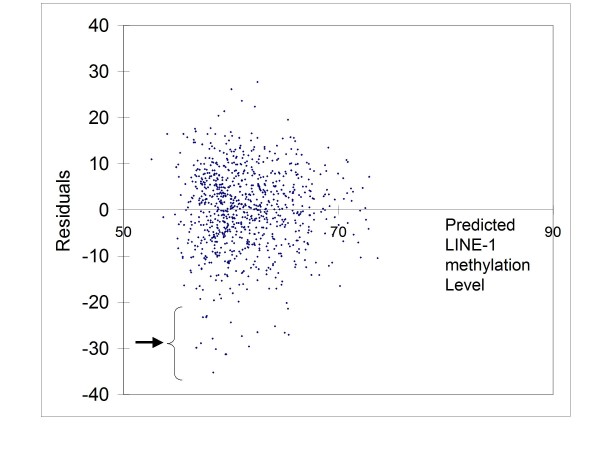
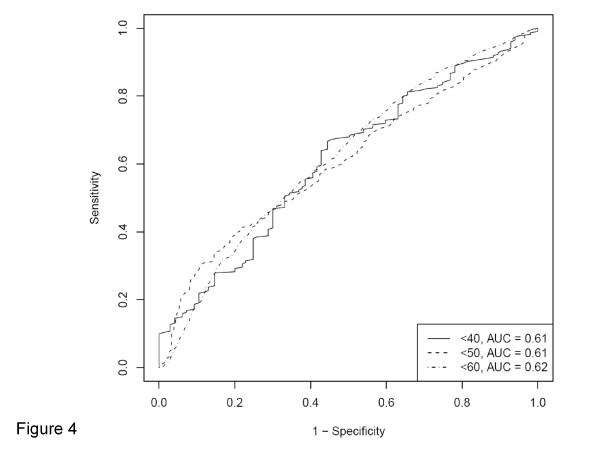
Results: Tumoral LINE-1 methylation ranged from 23.1 to 90.3 of 0-100 scale (mean 61.4; median 62.3; standard deviation 9.6), and distributed approximately normally except for extreme hypomethylators [LINE-1 methylation < 40; N = 22 (2.5%), which were far more than what could be expected by normal distribution]. LINE-1 extreme hypomethylators were significantly associated with younger patients (p = 0.0058). Residual plot by multivariate linear regression showed that LINE-1 extreme hypomethylators clustered as one distinct group, separate from the main tumor group. The multivariate linear regression model could explain 8.4% of the total variability of LINE-1 methylation (R-square = 0.084). Multivariate logistic regression models for binary LINE-1 hypomethylation outcomes (cutoffs of 40, 50 and 60) showed at most fair predictive ability (area under receiver operator characteristics curve < 0.63).
Conclusions: LINE-1 extreme hypomethylators appear to constitute a previously-unrecognized, distinct subtype of colorectal cancers, which needs to be confirmed by additional studies. Our tumor LINE-1 methylation data indicate enormous epigenomic diversity of individual colorectal cancers.
Figures
References
-
- Rodriguez J, Frigola J, Vendrell E, Risques RA, Fraga MF, Morales C, Moreno V, Esteller M, Capella G, Ribas M, Peinado MA. Chromosomal Instability Correlates with Genome-wide DNA Demethylation in Human Primary Colorectal Cancers. Cancer Res. 2006;66(17):8462–9468. doi: 10.1158/0008-5472.CAN-06-0293. - DOI - PubMed
Publication types
MeSH terms
Substances
Grants and funding
LinkOut - more resources
Full Text Sources
Other Literature Sources
Medical
Research Materials
Miscellaneous
