Spontaneous chiral symmetry breaking in early molecular networks
- PMID: 20507625
- PMCID: PMC2894767
- DOI: 10.1186/1745-6150-5-38
Spontaneous chiral symmetry breaking in early molecular networks
Abstract
Background: An important facet of early biological evolution is the selection of chiral enantiomers for molecules such as amino acids and sugars. The origin of this symmetry breaking is a long-standing question in molecular evolution. Previous models addressing this question include particular kinetic properties such as autocatalysis or negative cross catalysis.
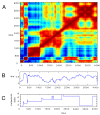
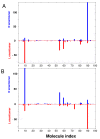
Results: We propose here a more general kinetic formalism for early enantioselection, based on our previously described Graded Autocatalysis Replication Domain (GARD) model for prebiotic evolution in molecular assemblies. This model is adapted here to the case of chiral molecules by applying symmetry constraints to mutual molecular recognition within the assembly. The ensuing dynamics shows spontaneous chiral symmetry breaking, with transitions towards stationary compositional states (composomes) enriched with one of the two enantiomers for some of the constituent molecule types. Furthermore, one or the other of the two antipodal compositional states of the assembly also shows time-dependent selection.
Conclusion: It follows that chiral selection may be an emergent consequence of early catalytic molecular networks rather than a prerequisite for the initiation of primeval life processes. Elaborations of this model could help explain the prevalent chiral homogeneity in present-day living cells.
Figures


Similar articles
-
Systems protobiology: origin of life in lipid catalytic networks.J R Soc Interface. 2018 Jul;15(144):20180159. doi: 10.1098/rsif.2018.0159. J R Soc Interface. 2018. PMID: 30045888 Free PMC article. Review.
-
Kinetic Resolution as a General Approach to Enantioenrichment in Prebiotic Chemistry.Acc Chem Res. 2024 Aug 20;57(16):2234-2244. doi: 10.1021/acs.accounts.4c00135. Epub 2024 Aug 8. Acc Chem Res. 2024. PMID: 39115809
-
Excess mutual catalysis is required for effective evolvability.Artif Life. 2012 Summer;18(3):243-66. doi: 10.1162/artl_a_00064. Epub 2012 Jun 4. Artif Life. 2012. PMID: 22662913
-
Chiral Symmetry Breaking in Peptide Systems During Formation of Life on Earth.Orig Life Evol Biosph. 2018 Mar;48(1):93-122. doi: 10.1007/s11084-017-9551-4. Epub 2017 Nov 8. Orig Life Evol Biosph. 2018. PMID: 29119380
-
Spontaneous mirror symmetry breaking and origin of biological homochirality.J R Soc Interface. 2017 Dec;14(137):20170699. doi: 10.1098/rsif.2017.0699. J R Soc Interface. 2017. PMID: 29237824 Free PMC article. Review.
Cited by
-
Systems protobiology: origin of life in lipid catalytic networks.J R Soc Interface. 2018 Jul;15(144):20180159. doi: 10.1098/rsif.2018.0159. J R Soc Interface. 2018. PMID: 30045888 Free PMC article. Review.
-
Chiral symmetry breaking and information accumulation in pre-biological protocell evolution.Sci Rep. 2025 Apr 14;15(1):12806. doi: 10.1038/s41598-025-97319-2. Sci Rep. 2025. PMID: 40229319 Free PMC article.
-
Emergence of homochirality in large molecular systems.Proc Natl Acad Sci U S A. 2021 Jan 19;118(3):e2012741118. doi: 10.1073/pnas.2012741118. Proc Natl Acad Sci U S A. 2021. PMID: 33431670 Free PMC article.
-
Control over the emerging chirality in supramolecular gels and solutions by chiral microvortices in milliseconds.Nat Commun. 2018 Jul 3;9(1):2599. doi: 10.1038/s41467-018-05017-7. Nat Commun. 2018. PMID: 29968753 Free PMC article.
-
Chemical Systems Involving Two Competitive Self-Catalytic Reactions.ACS Omega. 2019 Mar 26;4(3):5879-5899. doi: 10.1021/acsomega.9b00133. eCollection 2019 Mar 31. ACS Omega. 2019. PMID: 31459737 Free PMC article. Review.
References
-
- Bonner WA. Homochirality and life. Exs. 1998;85:159–188. - PubMed
-
- Siegel JS. Homochiral imperative of molecular evolution. Chirality. 1998;10:24–27.
Publication types
MeSH terms
LinkOut - more resources
Full Text Sources

