. 2010 Oct;38(18):6247-64.
doi: 10.1093/nar/gkq414. Epub 2010 May 27.

Molecular dynamics simulations suggest that RNA three-way junctions can act as flexible RNA structural elements in the ribosome

Affiliations

Molecular dynamics simulations suggest that RNA three-way junctions can act as flexible RNA structural elements in the ribosome

Ivana Besseová et al. Nucleic Acids Res. 2010 Oct.

Abstract

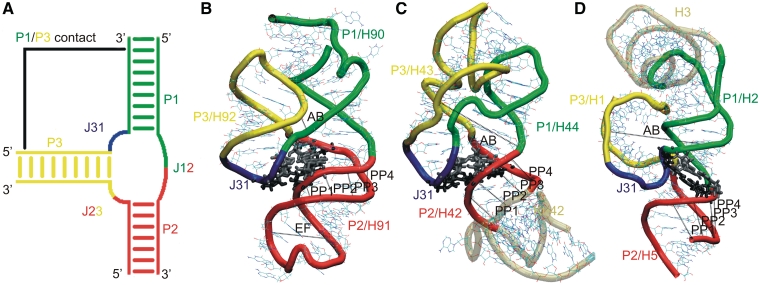
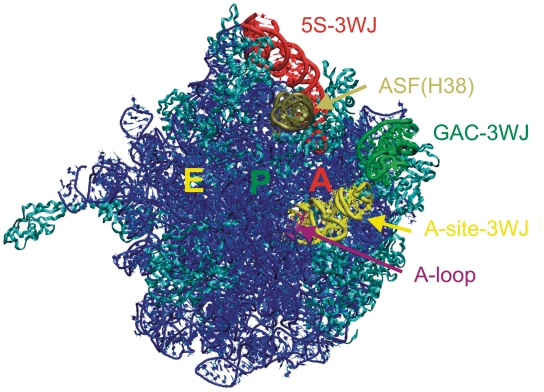
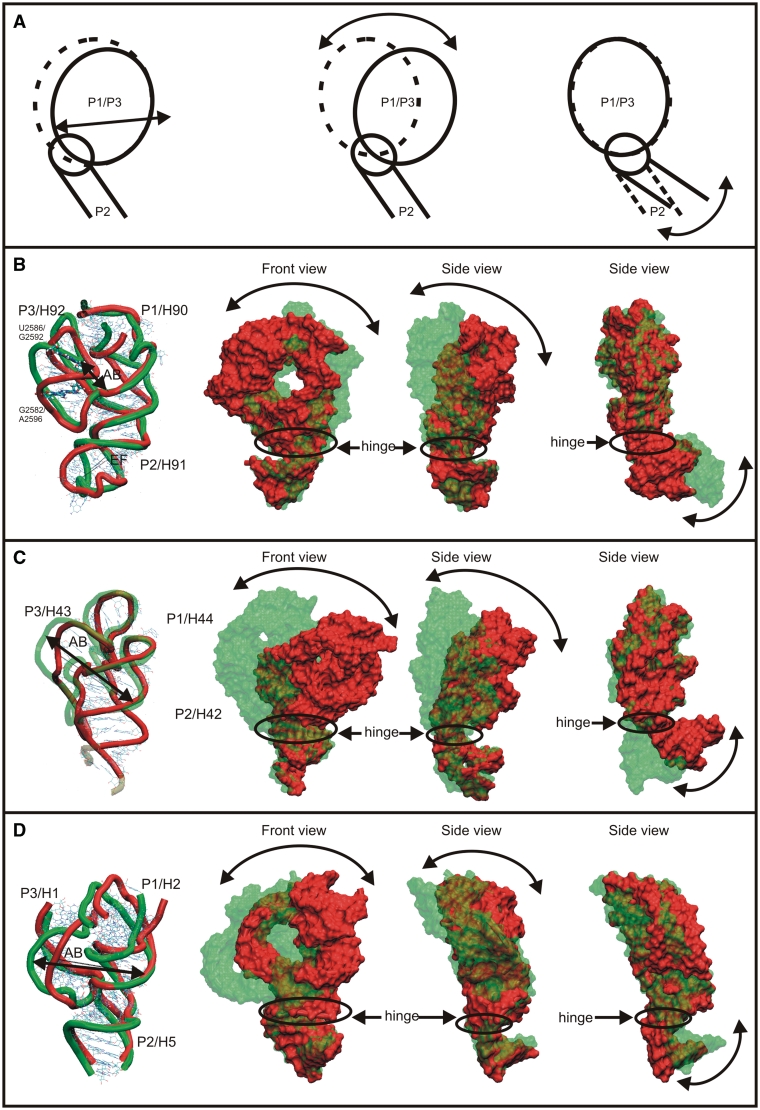
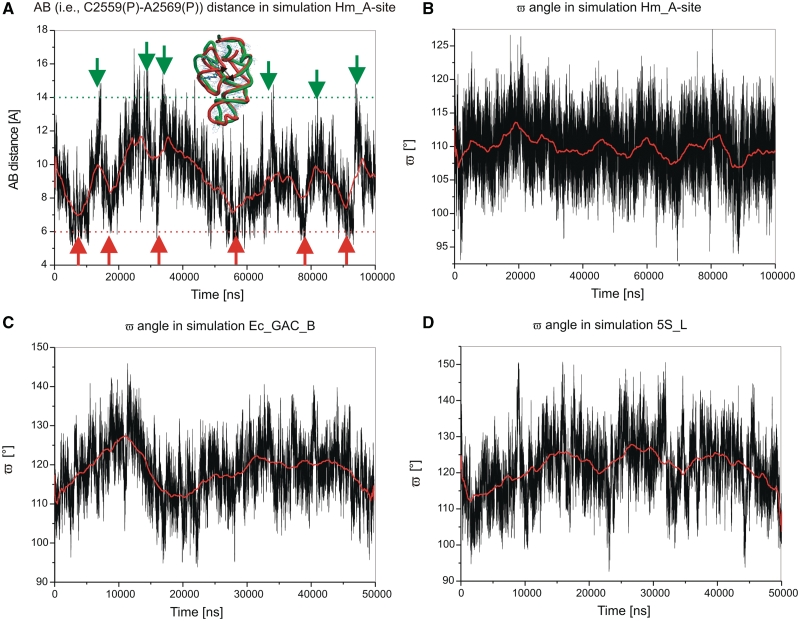
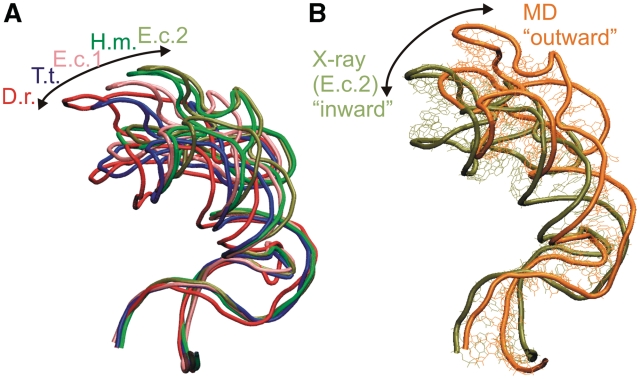
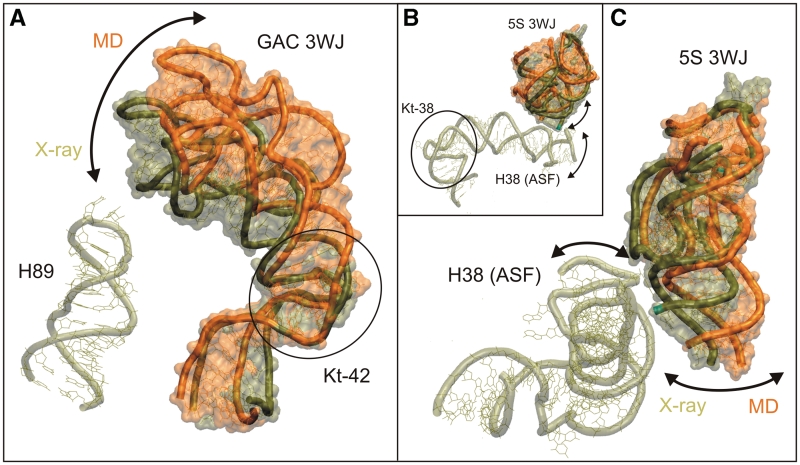
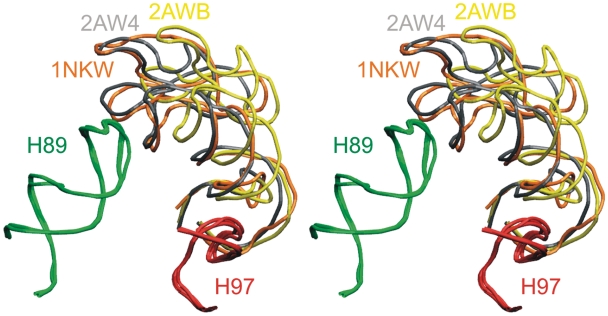
We present extensive explicit solvent molecular dynamics analysis of three RNA three-way junctions (3WJs) from the large ribosomal subunit: the 3WJ formed by Helices 90-92 (H90-H92) of 23S rRNA; the 3WJ formed by H42-H44 organizing the GTPase associated center (GAC) of 23S rRNA; and the 3WJ of 5S rRNA. H92 near the peptidyl transferase center binds the 3'-CCA end of amino-acylated tRNA. The GAC binds protein factors and stimulates GTP hydrolysis driving protein synthesis. The 5S rRNA binds the central protuberance and A-site finger (ASF) involved in bridges with the 30S subunit. The simulations reveal that all three 3WJs possess significant anisotropic hinge-like flexibility between their stacked stems and dynamics within the compact regions of their adjacent stems. The A-site 3WJ dynamics may facilitate accommodation of tRNA, while the 5S 3WJ flexibility appears to be essential for coordinated movements of ASF and 5S rRNA. The GAC 3WJ may support large-scale dynamics of the L7/L12-stalk region. The simulations reveal that H42-H44 rRNA segments are not fully relaxed and in the X-ray structures they are bent towards the large subunit. The bending may be related to L10 binding and is distributed between the 3WJ and the H42-H97 contact.


Figures

Figure 1.
Figure 1.
(A) Schematic representation of the components of RNA 3WJs. The P1/P3 contact occurs only in type C 3WJs. Simulated systems: (B) H90–H92 segment of 23S rRNA; (C) H42–H44 segment of 23S rRNA; and (D) H1–H3 and H5 of 5S rRNA. The junction regions are shown in color as in (A). The gray regions in (B) and (C) are included in the simulations, but are formally outside the junction. Black lines (AB, PP1–PP4 and EF) represent the distances describing the motions (see below). Tertiary A-minor I and A-minor II interactions (57,58) (or equivalent interactions) of the junction region (see below) are shown in gray and black licorice representations.
Figure 2.
Figure 2.
‘Crown view’ of the E. coli 50S ribosomal subunit, viewed from the position of the 30S subunit, with A, P and E tRNA binding sites labeled. In addition to the 3WJs, the A-loop (in purple) and the ASF (comprising H38, in tan) are highlighted. The rest of the RNA is in blue and ribosomal proteins are in cyan.
Figure 3.
Figure 3.
Base pairing in the X-ray structures of the simulated systems using symbols for base pairs by Leontis et al. (29): (A) H90–H92 from the 23S rRNA of H. marismortui (36) (simulation Hm_A-site; cf. Table 1 for the respective simulation names), (B) H42–H44 from the 23S rRNA of E. coli (62) (simulations Ec_GAC_B and Ec_GAC_4) and (C) H1–H3 and H5 from the 5S rRNA of H. marismortui (91) (simulation 5S_L). The large black boxes define the 3WJ parts (3WJ residues, see also Table 1) of the simulated structures. For the H42–H44 system, we also indicate positions of the Kt with its attached C and NC-stems. Control simulation 5S_S was executed for a smaller system, which is marked by the large purple box. The backbone is represented by blue lines, while other single H-bonds are represented by black dashed lines. Residues in black boxes are involved in tertiary interactions. The residues forming J31 parts are demarcated by blue rectangle area. Nucleotides in syn-conformation are written in red. The 3WJs contain essential base triplets, usually represented by A-minor I (first triplet) and A-minor II (second triplet) interactions, which are marked by orange and green rectangles, respectively. In the 5S 3WJ, the A-minor II interaction is replaced by equivalently positioned CCG triple and A-minor I interaction by cis H/SE base pair C67/A65 (Supplementary Figure S2). G2751 in (B) comes from H97 and was included only in some simulations (see Table 1 for detailed description). The E. coli A-site and H. marismortui GAC systems are shown in Supplementary Figure S3. To avoid cluttering, base–phosphate interactions are not shown (92).
Figure 4.
Figure 4.
(A) Schematic view of the two dominant motions found in the simulations. (B), (C) and (D) show dynamics of A-site 3WJ (simulation Hm_A-site), GAC 3WJ (simulation Ec_GAC_B) and 5S 3WJ (simulation 5S_L), respectively. Note that (C) includes only the upper part of H42 and does not capture the dynamics of the Kt-42 (14,61). Left—superposition of two substates illustrating the breathing-like motion of P1/P3 regions in MD simulations. The figure is oriented to provide the best view on all three helices. Middle—two views (rotated by 90°) of the overlay of simulated 3WJ structures with maximal amplitudes of the hinge-like motion. The P2 stems are superimposed to visualize the relative motion of the P1/P3 part versus the P2 helix. Right—the same structures as in the middle but superimposed using the P1 helix. PDB files of structures used to visualize the hinge-like dynamics are in the Supplementary Data that also contains graphs showing time courses of representative quantities.
Figure 5.
Figure 5.
(A) Time development of AB [i.e. C2591(P)…G2603(P)] distance in the Hm_A-site simulation. The geometries in extremes are defined if the AB value is >14 Å or <6 Å; the border is marked in red or green, respectively. (B), (C) and (D) show ω angle in simulations Hm_A-site, Ec_GAC_B and 5S-Ls, respectively. All data were smoothed (in red) taking 5000 consecutive 2 fs points. Many additional graphs are shown in Supplementary Data.
Figure 6.
Figure 6.
(A) Superposition of H42–H44 region (including the complete H42 with Kt) from five crystal structures [Deinococcus radiodurans (D.r.)-1NKW (93), T.t.-3D5B (94), E.c.1-2AW4 (62), H.m.-1JJ2 (36) and E.c.2-2AWB (62)] illustrates the range of geometries in the X-ray structures. The body of the large ribosomal subunit, which is not shown is on the left—see Supplementary Figure S28. (B) Comparison of H42–H44 X-ray structure from E. coli. (using the open 2AWB structure) and relaxed averaged geometry (31–40 ns) from Ec_GAC_B simulation. The superposition is done using residues C1044–G1051 and U1108–A1111 in NC-stem of H42. MD simulations prefer more open (outward) geometries compared to the range of geometries seen in the experiment. We were not able to find a clear structural descriptor of the motion, similar to the experimental studies (60). It may be caused by summation of a number of small effects.
Figure 7.
Figure 7.
(A) Comparison of H42–H44 X-ray structure from E. coli [tan, using the more outward 2AWB (62) geometry, see also Figure 6] and the relaxed averaged geometry (31–40 ns, in orange) from the Ec_GAC_B simulation. The superposition is done using residues C1044–G1051 and U1108–A1111 in the NC-stem of H42. MD simulations prefer more open geometries compared to the X-ray structures. Nevertheless, movements toward H89 would be along the low-energy deformation path and thus are easily achievable, especially when assuming that the RNA is restricted by the H42/H97 interaction (Figure 8). (B) Superposition of the 5S RNA junction from the H. marismortui crystal structure 1S72 (91) (in tan) and the averaged geometry (in 22–23 ns, in orange) in the 5S_L simulation done over residues 16–28 and 57–64 in H2. Further, the relative position of ASF (also in tan) with its Kt-38 elbow region is shown. A recent simulation study (90) indicates that significant part of the directional dynamics of the ASF may stem from the flexible Kt-38. The arrows show the fluctuations consistent with simulations of the H38 elbow region and of the 5S rRNA 3WJ. (C) Detailed view on the 5S 3WJ and the bottom part of the ASF. The anisotropic flexibility of the H5 in 5S 3WJ revealed by the MD simulations complements the anisotropic flexibility of the ASF elbow region.
Figure 8.
Figure 8.
Stereoview of the superimposed H97 (in red) and H89 (in green), together with the GAC position from the crystal structures of T. thermophilus (1NKW, in orange) and E. coli (2AWB, in yellow and 2AW4, in gray) ribosomes. It is notable that the H89 and H97 are almost perfectly superimposable, while the structural difference between the GAC positions appears to originate above the H42–H97 contact point. This clearly indicates flexibility of the GAC 3WJ, entirely in line with the simulation results.

Similar articles

Cited by

References

    1. Lescoute A, Westhof E. Topology of three-way junctions in folded RNAs. RNA. 2006;12:83–93. - PMC - PubMed
    1. McDowell SE, Spackova N, Sponer J, Walter NG. Molecular dynamics simulations of RNA: an in silico single molecule approach. Biopolymers. 2007;85:169–184. - PMC - PubMed
    1. Hall KB. RNA in motion. Curr. Opin. Chem. Biol. 2008;12:612–618. - PMC - PubMed
    1. Auffinger P, Hashem Y. Nucleic acid solvation: from outside to insight. Curr. Opin. Struct. Biol. 2007;17:325–333. - PubMed
    1. Cheatham TE. Simulation and modeling of nucleic acid structure, dynamics and interactions. Curr. Opin. Struct. Biol. 2004;14:360–367. - PubMed

Publication types

MeSH terms