. 2010 Jul;16(7):1402-19.
doi: 10.1261/rna.2135210. Epub 2010 May 27.

Tombusvirus recruitment of host translational machinery via the 3' UTR

Affiliations

Tombusvirus recruitment of host translational machinery via the 3' UTR

Beth L Nicholson et al. RNA. 2010 Jul.

Abstract

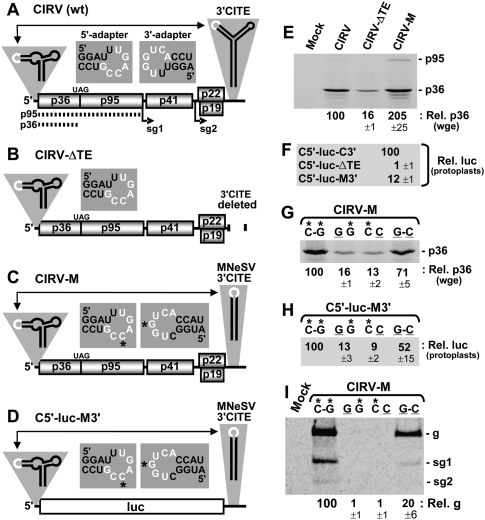
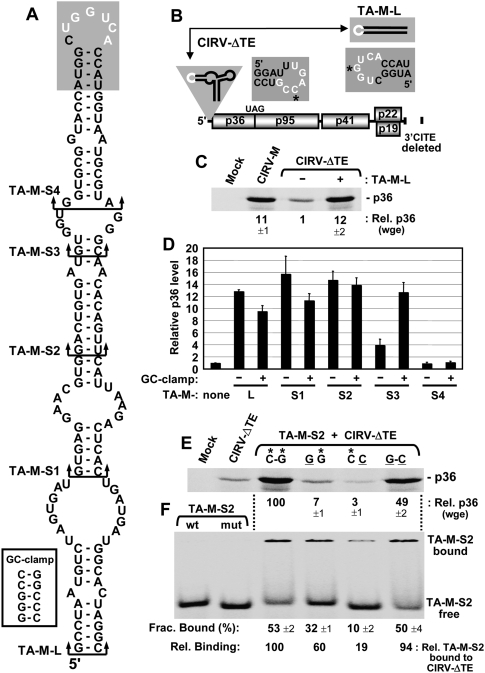
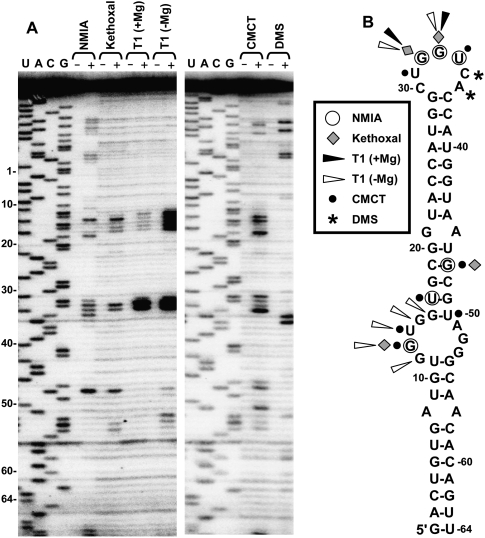
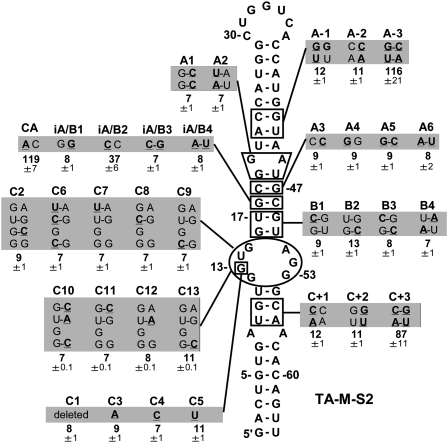
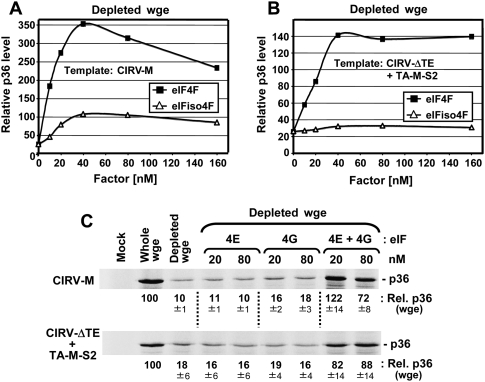
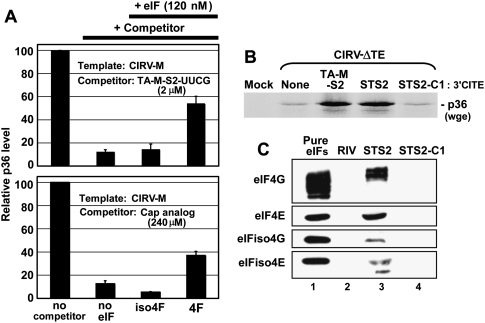
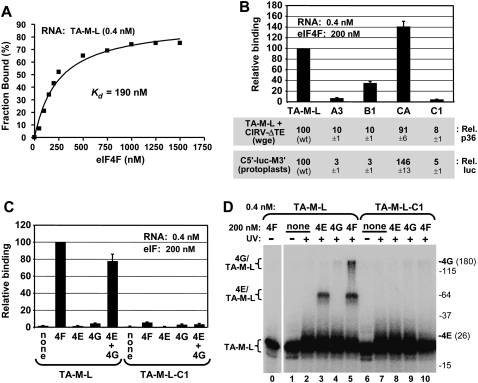
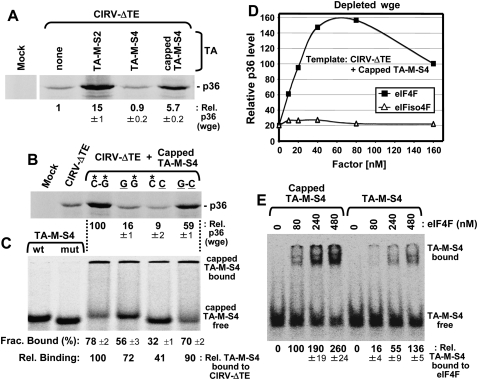
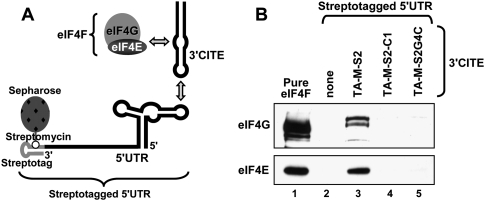
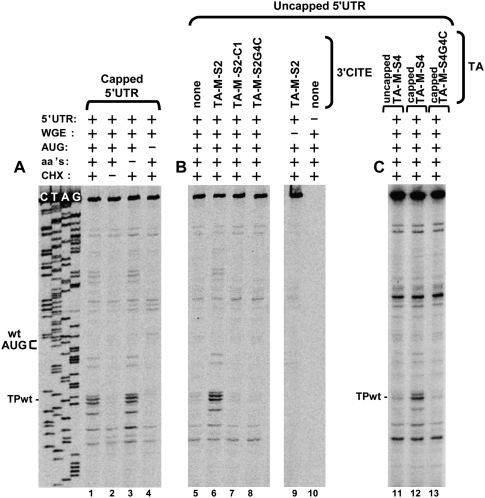
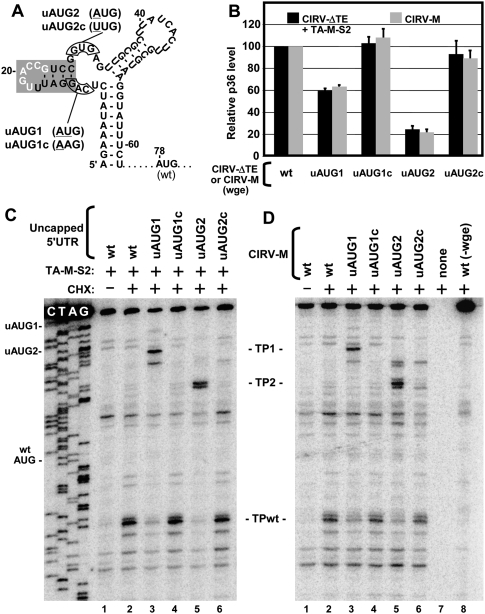
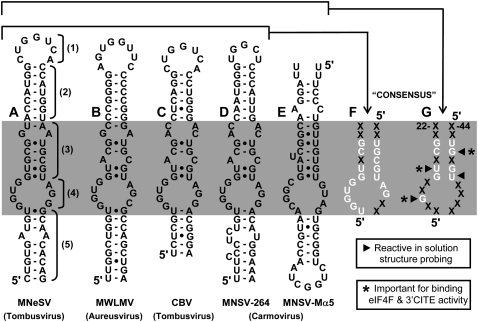
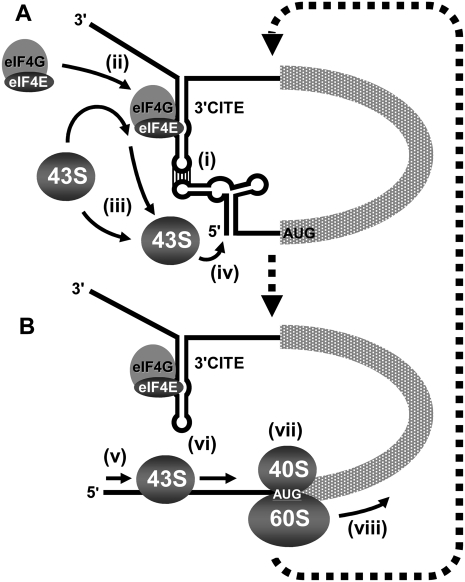
RNA viruses recruit the host translational machinery by different mechanisms that depend partly on the structure of their genomes. In this regard, the plus-strand RNA genomes of several different pathogenic plant viruses do not contain traditional translation-stimulating elements, i.e., a 5'-cap structure and a 3'-poly(A) tail, and instead rely on a 3'-cap-independent translational enhancer (3'CITE) located in their 3' untranslated regions (UTRs) for efficient synthesis of viral proteins. We investigated the structure and function of the I-shaped class of 3'CITE in tombusviruses--also present in aureusviruses and carmoviruses--using biochemical and molecular approaches and we determined that it adopts a complex higher-order RNA structure that facilitates translation by binding simultaneously to both eukaryotic initiation factor (eIF) 4F and the 5' UTR of the viral genome. The specificity of 3'CITE binding to eIF4F is mediated, at least in part, through a direct interaction with its eIF4E subunit, whereas its association with the viral 5' UTR relies on complementary RNA-RNA base-pairing. We show for the first time that this tripartite 5' UTR/3'CITE/eIF4F complex forms in vitro in a translationally relevant environment and is required for recruitment of ribosomes to the 5' end of the viral RNA genome by a mechanism that shares some fundamental features with cap-dependent translation. Notably, our results demonstrate that the 3'CITE facilitates the initiation step of translation and validate a molecular model that has been proposed to explain how several different classes of 3'CITE function. Moreover, the virus-host interplay defined in this study provides insights into natural host resistance mechanisms that have been linked to 3'CITE activity.


Figures

FIGURE 1.
FIGURE 1.
In vitro and in vivo analysis of Tombusvirus 3′CITE activity. (A–D) Schematic depictions of the RNA genomes of (A) CIRV, (B) CIRV-ΔTE, (C) CIRV-M, and (D) reporter mRNA C5′-luc-M3′. Encoded proteins are shown as boxes and noncoding regions are represented by the thick horizontal line. In CIRV and its derivatives, p36 and its read-through product p95 are translated directly from the viral genome as shown by the dotted lines in A. Sg1 and sg2 correspond to the initiation sites for sg mRNAs that are transcribed during infections. Relevant RNA structures in the 5′ and 3′ UTRs are depicted schematically above the message termini with the adapter segments denoted in white. Double-headed arrows represent 5′-3′ RNA–RNA interactions involving base-pairing between the adapter sequences in the terminal structures. The actual sequences of the 5′ and 3′ adapters in these terminal structures are shown in the center just above the messages. The nucleotides in white represent complementary residues, and those with asterisks in C and D correspond to the residues targeted for compensatory mutational analysis in GI. The luc ORF corresponds to firefly luciferase and the message is not to scale. (E) SDS-PAGE analysis of proteins generated from 0.5 pmol of in vitro-generated transcripts of viral genome during a 1-h incubation at 25°C in wge in the presence of 35S-Met. The identities of the viral genomes are indicated above each lane (“mock” indicates that no RNA was added to the reaction). Relative p36 levels, quantified by radioanalytical scanning of the gel and normalized to WT CIRV (set to 100), are indicated below with standard errors of the mean (SEM) from three experiments. (F) Relative luciferase activity measured following a 5-h incubation of protoplasts transfected with the indicated viral mRNAs. Values (±SEM) are expressed as a percentage relative to that for C5′-luc-C3′ (set to 100). (G) SDS-PAGE analysis of p36 generated from CIRV-M and its compensatory mutants in wge to assess the importance of complementarity between the 5′ and 3′ adapters. Above each lane, the left nucleotide of the pair is in the 5′ adapter, while the right nucleotide is in the 3′ adapter. The asterisks indicate WT nucleotides and correspond to those shown in the adapter sequences in C. (H) Relative luciferase activity in protoplasts from C5′-luc-M3′ and its compensatory mutants with substitutions in the 5′ and 3′ adapters at the positions indicated by asterisks in (D). (I) Northern blot analysis detecting viral RNAs isolated 22 h posttransfection from protoplasts inoculated with CIRV-M and its compensatory mutants described in G. The positions of the viral genomic (g) and subgenomic (sg1 and sg2) RNAs are indicated to the right, while relative viral genome levels, calculated as a percentage (±SEM) of WT CIRV-M accumulation (set to 100), are shown below the blot.
FIGURE 2.
FIGURE 2.
Defining a minimal trans-acting I-shaped 3′CITE. (A) Mfold-predicted RNA secondary structure for the 3′CITE TA-M-L. Arrowed brackets indicate the bottom of truncated forms of TA-M-L, designated TA-M-S1 through -S4. The GC-clamp added to the bottom of the 3′CITEs is shown in the white box, while the 3′ adapter at the top is shaded with the complementary sequence depicted in white. (B) Schematic representation of the CIRV-ΔTE genome and TA-M-L. The residues in the 5′ and 3′ adapters targeted for compensatory mutational analysis in E and F are indicated by asterisks. (C) SDS-PAGE analysis of p36 levels from CIRV-M or CIRV-ΔTE in the absence (−) or presence (+) of a 10-fold molar excess of TA-M-L in wge. Values (±SEM) for p36 levels were normalized to that from CIRV-ΔTE alone (set to 1). (D) Relative p36 levels in wge from CIRV-ΔTE in the presence of TA-M-L or its truncated mutants depicted in (A) and specified below the graph, with (+) or without (−) the GC-clamp. Error bars indicate SEM. (E) SDS-PAGE analysis of p36 levels in wge reactions containing CIRV-ΔTE and TA-M-S2 harboring compensatory mutations as described in Fig. 1G. (F) RNA–RNA EMSA by nondenaturing PAGE assessing CIRV-ΔTE binding to TA-M-S2 using the WT and compensatory mutants analyzed in E. The left-most lanes show the positions of free WT (containing *G) and mutant (containing C) TA-M-S2 used in the EMSAs in the lanes to the right. Five nanomolars of 32P-labeled WT or mutant TA-M-S2 was incubated with 500 nM of WT or mutant CIRV-ΔTE for 30 min at 25°C. Complexes were then separated in a nondenaturing acrylamide gel, and the fraction of bound TA-M-S2 was quantified (±SEM) by radioanalytical scanning of the gel. Relative binding values were normalized to that for WT (C–G) binding (set to 100).
FIGURE 3.
FIGURE 3.
Solution structure probing of the 3′CITE. (A) Denaturing acrylamide gel showing products of primer extension of TA-M-L after treatment with the enzyme RNase T1 (T1) plus or minus Mg++ or the chemicals N-methylisatoic anhydride (NMIA), kethoxal, 1-cyclohexyl-(2-morpholinoethyl)carbodiimide metho-p-toluene sulfate (CMCT), or dimethyl sulfate (DMS). The (+) and (−) indicate treated and untreated RNA, respectively. Sequencing ladders generated with the same primer were run in the gels and relative coordinates for TA-M-S2 are indicted at the left. (B) Solution structure probing results were mapped onto the mfold-predicted secondary structure for TA-M-S2. Nucleotides in the structure that were reactive with the enzyme or chemicals are denoted by symbols that are defined in the box.
FIGURE 4.
FIGURE 4.
Mutational analysis of the 3′CITE. TA-M-S2 mutants are presented with names at the top, and nucleotide modifications are underlined and in bold in the shaded boxes. The relative p36 levels (±SEM) in wge from coincubations of CIRV-ΔTE and a 10-fold molar excess of the different TA-M-S2 mutants are shown below (normalized to a value of 100 for WT TA-M-S2).
FIGURE 5.
FIGURE 5.
3′CITE activity in eIF-depleted wheat germ extract supplemented with eIFs. (A) and (B) Representative data set from in vitro translation assays using eIF-depleted wge. The depleted extract was supplemented with the indicated amount of purified recombinant eIF4F or eIFiso4F before translation assays were performed. Relative p36 levels for (A) CIRV-M or (B) CIRV-ΔTE plus a 10-fold molar excess of TA-M-S2 are plotted and are relative to those for whole (i.e., nondepleted) wge (set at 100). (C) SDS-PAGE analysis of relative p36 levels (±SEM) from CIRV-M (upper panel) or CIRV-ΔTE plus TA-M-S2 (lower panel) in eIF-depleted wge supplemented with the indicated amounts of eIF4E, eIF4G, or both.
FIGURE 6.
FIGURE 6.
Interaction of the 3′CITE with eIFs. (A) Analysis of p36 levels in wge containing 5 nM CIRV-M and 2 μM TA-M-S2-UUCG (upper panel) or 5nM CIRV-M and 240 μM cap analog m7GTP (lower panel). The reactions containing the competitors were supplemented with 120 nM of the eIF indicated below the graphs. Relative p36 levels (±SEM) were normalized to that in the uninhibited reaction (set to 100). (B) SDS-PAGE analysis of p36 levels from CIRV-ΔTE in the presence of TA-M-S2, its streptotagged counterpart STS2 or streptotagged mutant STS2-C1. (C) Western blots showing the detection of eIFs (indicated on the left) in eluates from columns with different streptotagged RNAs (indicated above the blots) immobilized on streptomycin-conjugated sepharose and incubated with wge. The negative control, RIV, is a streptotagged version of the 3′-terminal 82 nt of TBSV. After immobilization of the tagged viral RNAs in the column, wge was added to the columns and incubated for 1 h at 4°C, followed by washing. Streptotagged RNAs and bound proteins were eluted with free streptomycin, separated by SDS-PAGE, and analyzed by Western blotting using antisera against individual eIF subunits. The eIF standards in lane 1 contained 1.8 pmol of each subunit.
FIGURE 7.
FIGURE 7.
Binding of the 3′CITE to eIF4F and its subunits. (A) Representative binding curve of the TA-M-L/eIF4F complex determined by filter-binding analysis and used to determine the Kd. 32P-labeled TA-M-L (0.4 nM) was incubated with the indicated amounts of eIF4F for 60 min at 25°C, and the fraction of bound RNA was determined by quantifying the radioactivity of protein–RNA complexes retained on a nitrocellulose membrane. (B) eIF4F binding and translation activities of TA-M-L and mutants. Relative binding levels of TA-M-L and its mutants to eIF4F were determined by filter-binding assays at the indicated concentrations (upper panel). Relative binding values were normalized to binding of WT TA-M-L to eIF4F (set to 100). TA-M-L and its mutants were assayed for translation activity via p36 levels in wge in coincubations with CIRV-ΔTE (middle panel), and corresponding 3′CITE mutants in C5′-luc-M3′ were assayed for translational activity via relative luciferase levels in protoplasts (lower panel). (C) Binding of TA-M-L and mutant TA-M-L-C1 to purified recombinant eIF4E, eIF4G, or both, was assayed by filter-binding at the concentrations indicated. Relative binding values were normalized to binding of WT TA-M-L to eIF4F (set to 100). (D) UV cross-linking analysis of TA-M-L and TA-M-L-C1 interactions with eIF4F and its subunits. Radiolabeled RNA (0.4 nM) was incubated with 200 nM eIF4F or its individual subunits for 60 min at 25°C and then irradiated with 254 nm light for 15 min, followed by separation by 10% SDS-PAGE. The positions of molecular weight markers in the gel are indicated to the right (in kDa) along with the locations of free eIF4E (26 kDa) and eIF4G (180 kDa) in the gel. The positions of bands corresponding to free RNA (TA-M-L) or RNA cross-linked with eIF4G (4G/TA-M-L) or eIF4E (4E/TA-M-L) are indicated to the left of the gel.
FIGURE 8.
FIGURE 8.
Recapitulating 3′CITE activity with a cap structure. (A) SDS-PAGE analysis of relative p36 levels from wge reactions containing CIRV-ΔTE in the presence of a 10-fold molar excess of TA-M-S2, TA-M-S4, or capped TA-M-S4. (B) SDS-PAGE analysis of compensatory mutants for capped TA-M-S4 and CIRV-ΔTE in wge reactions analyzed by SDS-PAGE. The base pair between the 5′ adapter in CIRV-ΔTE and 3′ adapter in TA-M-S4 was disrupted (GG, CC) and then restored (GC) as described in Figure 2E. (C) RNA–RNA EMSA by nondenaturing PAGE was used to assess CIRV-ΔTE binding with radiolabeled TA-M-S4 using the WT and compensatory mutants analyzed in (B) and described in Figure 2F. (D) Assessment of p36 levels from coincubations of CIRV-ΔTE and capped TA-M-S4 in eIF-depleted wge supplemented with the indicated amounts of eIF4F or eIFiso4F. Values are relative to those for whole (i.e., nondepleted) wge (set at 100). (E) RNA–protein EMSA by nondenaturing 4% PAGE to determine relative binding levels of radiolabeled capped or uncapped TA-M-S4 (0.4 nM) to the indicated amounts of eIF4F.
FIGURE 9.
FIGURE 9.
Formation of a 5′ UTR/3′ CITE/eIF4F complex in wge. (A) Cartoon depicting the formation of a 5′ UTR/3′CITE/eIF4F complex in a streptomycin-conjugated sepharose column. (B) Western blot analysis showing detection of eIF4F subunits in eluates from affinity columns. The 5′ UTR segment was immobilized in columns via its streptotag and TA-M-S2, its mutant TA-M-S2-C1 (with the critical G13 deleted), or mutant TA-M-S2G4C (containing the same 3′-adapter substitution as mutant CC in Fig. 2E,F) or no 3′CITE were subsequently applied. Following a 30-min incubation, the column was washed. Next, wge was added to the columns and allowed to incubate for 60 min, followed by washing. Eluates from the columns, released by adding streptomycin, were analyzed by Western blotting with antisera to eIF4G and eIF4E. The eIF standards in lane 1 contained 0.6 pmol of each subunit.
FIGURE 10.
FIGURE 10.
Toe-printing analysis of 3′CITE-dependent ribosome loading on viral 5′ UTRs. Denaturing PAGE showing the products of primer extension generated by reverse transcription of the CIRV 5′ UTR segment. 5′ UTR segments were incubated in translationally competent wge containing cycloheximide (CHX) for 20 min at 25°C. A radiolabeled oligonucleotide, complementary to a downstream region in the 5′ UTR fragment (i.e., 84-nt 3′ to the WT start codon), was then added to the reaction and extended by reverse transcriptase. Primer extension products corresponding to toe-prints from stalled ribosomes were then assessed under different conditions, which are indicated at the top of the gels. Toe-print analysis of (A) the capped 5′ UTR segment, (B) the uncapped 5′ UTR segment in the presence of WT or mutant TA-M-S2, and (C) the uncapped 5′ UTR segment in the presence of capped and uncapped TA-M-S4. The positions of the WT start codon (WT AUG) and its corresponding toe-print (TPwt) are indicated.
FIGURE 11.
FIGURE 11.
Translation and toe-print analyses of viral 5′ UTRs containing upstream AUGs. (A) RNA secondary structure of the 5′-terminal segment of the CIRV 5′ UTR showing the positions where upstream AUGs (in uAUG1 and uAUG2) or control mutations (in uAUG1c and uAUG2c) were introduced relative to the WT AUG. Mutated nucleotides are underlined and the shaded stem–loop corresponds to the 5′ adapter. (B) Translation assay monitoring p36 levels from WT, uAUG, and control mutants of CIRV-M (gray bars) or CIRV-ΔTE plus TA-M-S2 (black bars) in wge. (C) Toe-printing analysis of WT, uAUG, and control mutant 5′ UTR segments in the presence of TA-M-S2 in wge. (D) Toe-printing analysis of WT, uAUG, and control mutants of CIRV-M in wge. The toe-prints corresponding to uAUG1 and uAUG2 are labeled TP1 and TP2 and are located 17 and 18-20 nt, respectively, downstream from their cognate uAUGs.
FIGURE 12.
FIGURE 12.
Sequence and structure comparisons of I-shaped class 3′CITEs. (A–E) Mfold-predicted RNA secondary structures of I-shaped class 3′CITEs from different viruses, as indicated below. The numbered brackets in (A) correspond to the different regions (region 1–5) assigned to the 3′CITEMNeSV and the shaded band (i.e., region 3 and 4) highlights the central core that is very sensitive to mutation and has components conserved in all members of this class of 3′CITE, as revealed by the consensus in (F) that is based on AD and the more limited consensus in (G) that is based on AE. “X” represents an undefined nucleotide and the arrowheads and asterisks are defined in the accompanying boxes.
FIGURE 13.
FIGURE 13.
The RRP model for 3′CITE-mediated translational enhancement. Model depicting how the 3′CITEMNeSV is proposed to enhance viral translation. The viral genome is shown as a simplified linear mRNA that includes relevant higher order RNA structural elements in its 5′ and 3′ UTRs. (A) Initial steps in the proposed mechanism are shown, including (i) the 3′CITE interacting with the 5′ UTR via RNA–RNA base-pairing; (ii) 3′CITE simultaneously binding to eIF4F, thereby bringing it into proximity of the 5′ end of the genome; (iii) the 43S ribosomal subunit being recruited to the 5′ UTR via 3′CITE-bound eIF4F; and (iv) the 43S ribosome entering at or near the 5′ terminus. (B) Subsequent steps include (v) scanning of the 43S in a net 5′-3′ direction; (vi) concurrent disruption of the 3′CITE/5′ UTR interaction; (vii) recognition of the start codon and joining of the 60S subunit to form the 80S initiation complex; and (viii) the ribosome transitioning into the elongation stage of translation. (dotted arrows) Presumed cyclical nature of the process that would mediate repeated loading and initiation of ribosomes. See the text for additional details.

Similar articles

Cited by

References

    1. Batten JS, Desvoyes B, Yamamura Y, Scholthof KB 2006. A translational enhancer element on the 3′-proximal end of the Panicum mosaic virus genome. FEBS Lett 580: 2591–2597 - PubMed
    1. Belsham GJ 2009. Divergent picornavirus IRES elements. Virus Res 139: 183–192 - PubMed
    1. Browning KS 1996. The plant translational apparatus. Plant Mol Biol 32: 107–144 - PubMed
    1. Browning KS, Humphreys J, Hobbs W, Smith GB, Ravel JM 1990. Determination of the amounts of the protein synthesis initiation and elongation factors in wheat germ. J Biol Chem 265: 17967–17973 - PubMed
    1. Browning KS, Webster C, Roberts JK, Ravel JM 1992. Identification of an isozyme form of protein synthesis initiation factor 4F in plants. J Biol Chem 267: 10096–10100 - PubMed

Publication types

LinkOut - more resources