Comparative Study
. 2010 Jul 30;285(31):23537-47.
doi: 10.1074/jbc.M109.096925. Epub 2010 May 27.

Comparison of macrophage antimicrobial responses induced by type II interferons of the goldfish (Carassius auratus L.)

Affiliations
Comparative Study

Comparison of macrophage antimicrobial responses induced by type II interferons of the goldfish (Carassius auratus L.)

Leon Grayfer et al. J Biol Chem. .

Abstract

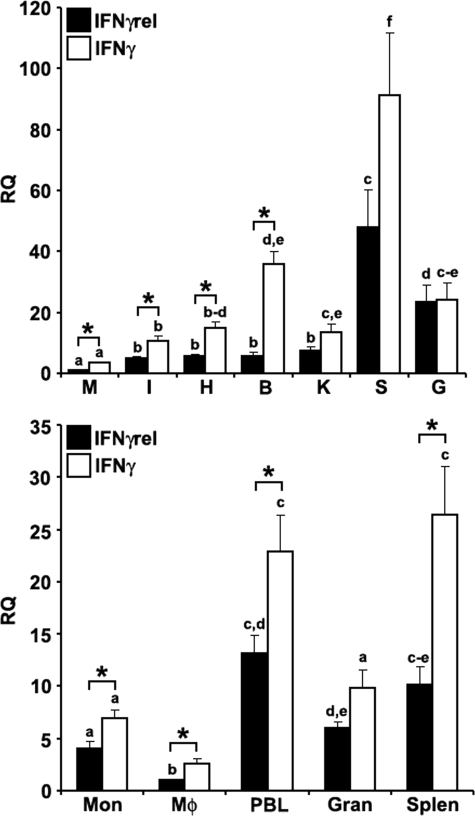
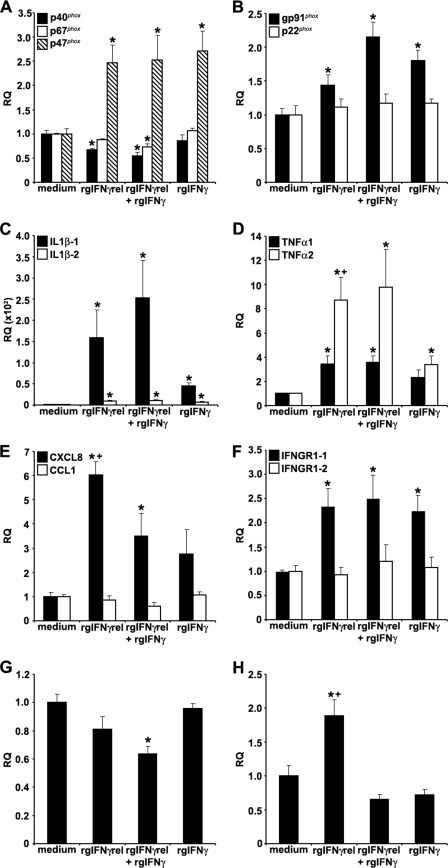
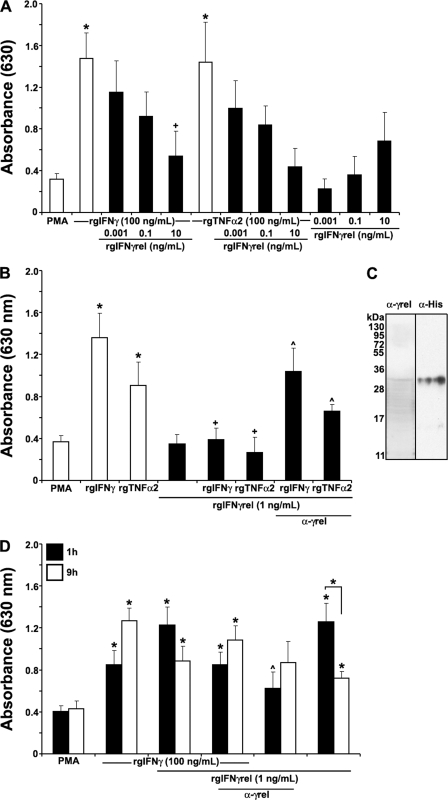
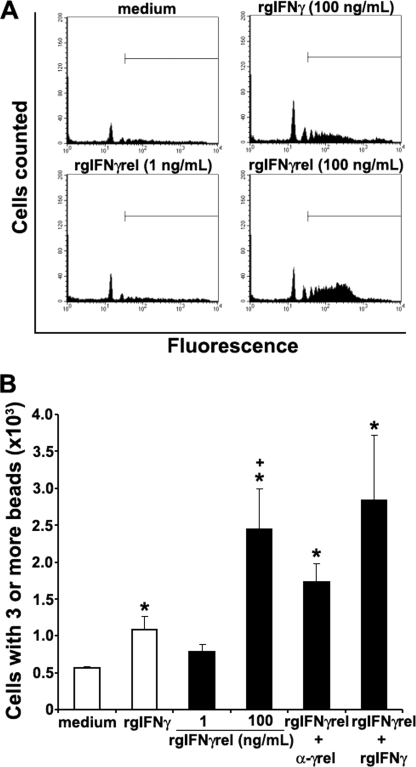
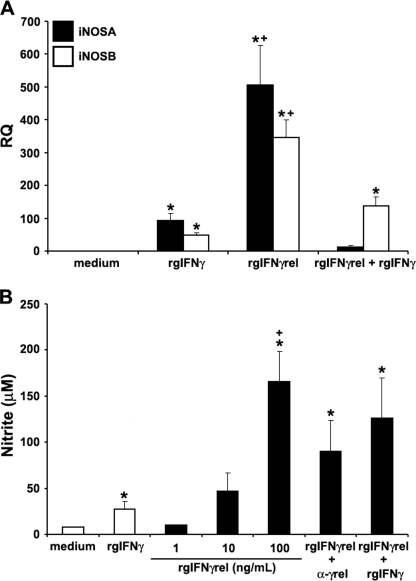
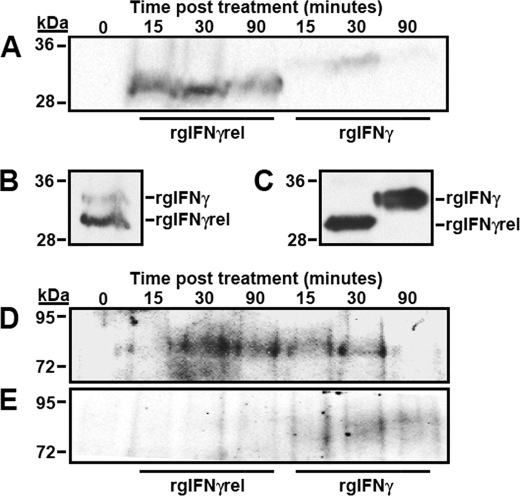
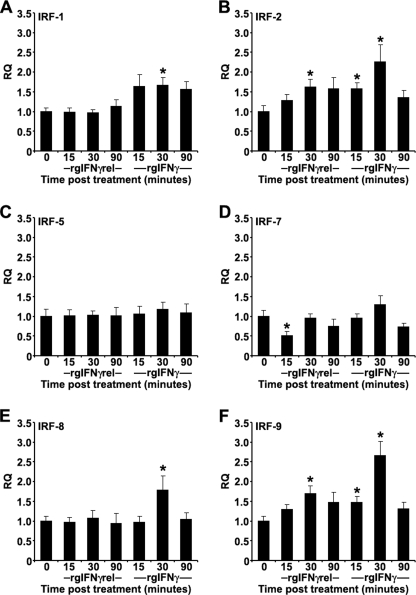
Unlike mammals, bony fish have two type II interferons, IFNgamma and IFNgammarel, whose pro-inflammatory functions have not been fully characterized. To elucidate the distinct roles of these type II interferons of bony fish, we examined the effects of recombinant goldfish (rg) IFNgamma and IFNgammarel on the macrophage antimicrobial responses, immune gene expression, and their signaling pathways. Our findings indicate that rgIFNgamma and rgIFNgammarel possess unique capacities to mediate each of the above processes. Q-PCR analysis revealed similar expression of both cytokines in tissues and immune cell populations of the goldfish, although IFNgamma mRNA levels were generally higher in most tissues and cell types. Whereas rgIFNgamma had long-lasting effects on the priming of goldfish monocyte ROI production, the rgIFNgammarel had relatively short-lived ROI priming potential and eventually down-regulated the priming of ROI production induced by rgIFNgamma or rgTNFalpha2. Whereas rgIFNgamma induced relatively modest phagocytic and nitric oxide responses of goldfish macrophages, rgIFNgammarel induced significantly higher phagocytosis, iNOSA and iNOSB gene expression and nitric oxide production compared with rgIFNgamma. The rgIFNgamma and rgIFNgammarel induced different gene expression profiles in goldfish monocytes. These differences included significantly higher induction of TNFalpha2, CXCL8, ceruloplasmin, and interferon regulatory factor (IRFs) expression after activation of monocytes with rgIFNgammarel. The rgIFNgammarel was more abundant in whole cell lysates compared with rgIFNgamma. Both cytokines induced the phosphorylation of Stat1, while the nuclear localization of Stat1 was only observed following treatment of monocytes with rgIFNgamma. Our findings suggest the presence of functional segregation of the induction of macrophage antimicrobial functions by type II interferons of bony fish.


Figures

FIGURE 1.
FIGURE 1.
Quantitative expression analysis of goldfish IFNγ and IFNγrel in tissues and immune cell populations obtained from healthy fish. Top, goldfish IFNγrel tissue expression analysis. The tissues examined were: muscle (M), intestine (I), heart (H), brain (B), kidney (K), spleen (S), and gill (G). The expression of goldfish IFNγrel was assessed relative to endogenous control gene, elongation factor 1 α (EF-1α). Analyses of the relative tissue expression data are for tissues from five fish (n = 5). All results were normalized against the muscle IFNγrel expression levels. Bottom, goldfish IFNγrel expression in different immune cell populations. The cells examined were: monocytes (Mon), macrophages (Mϕ), peripheral blood leukocytes (PBL), granulocytes (Gran), and splenocytes (Splen). Immune cells populations were derived from four fish (n = 4) and the expression normalized against that of FACS-sorted macrophages. Direct comparisons of IFNγ and IFNγrel expression was achieved by performing ddCT analysis using lowest expression as the standard for the expression of both cytokines. The RQ values were normalized against the lowest observed tissue or cell expression (IFNγrel, muscle, and monocytes, respectively). Statistical analysis was performed using one-way ANOVA. Different letters above each bar denote significant differences (p < 0.05), the same letter indicate no statistical difference between groups.
FIGURE 2.
FIGURE 2.
Quantitative expression analysis of goldfish immune genes in monocytes stimulated with rgIFNγrel, rgIFNγ, or a combination of both cytokines. The reported expression was relative to EF-1α. The genes examined included: (A), p40phox, p47phox, p67phox; (B) gp91phox, p22phox; (C) IL-1β-1, IL-1β-2; (D) TNFα1, TNFα2; (E) CXCL8, CCL1; (F) IFNGR1–1, IFNGR1–2; (G) TGFβ; (E) ceruloplasmin. The expression data were normalized against those observed in medium treated cells, respectively for each gene. The results are mean ± S.E. RQ values for monocytes obtained from cultures established from individual fish (n = 5). Statistical analysis was performed using one-way ANOVA, and the results were deemed to be significant at p < 0.05. (*) denotes significantly different (p < 0.05) from the respective medium treated controls and (+) denotes significantly different (p < 0.05) from respective rgIFNγ-treated cells.
FIGURE 3.
FIGURE 3.
Recombinant goldfish IFNγrel temporally regulates the priming of the monocyte reactive oxygen production. A, rgIFNγrel reduces the ROI production mediated by rgIFNγ and rgTNFα2. Cells were treated with medium, rgTNFα2 (100 ng/ml), rgIFNγ (100 ng/ml), rgIFNγrel (0.001, 0.1, 10 ng/ml), or a combination of rgTNFα2 (100 ng/ml), or rgIFNγ (100 ng/ml), and 0.001, 0.1, or 10 ng/ml of rgIFNγrel. B, application of an anti-rgIFNγrel partially restored the reactive oxygen production down-regulated by rgIFNγrel. Cells were treated with medium, rgTNFα2 (100 ng/ml), rgIFNγ (100 ng/ml), rgIFNγrel (1 ng/ml) or a combination of rgTNFα2 (100 ng/ml) or rgIFNγ (100 ng/ml), and 1 ng/ml of rgIFNγrel, alone or in conjuction with 5 μg/ml of α-rgIFNγrel polyclonal IgG. C, Western blot detection of rgIFNγrel using α-rgIFNγrel IgG and α-His IgG. D, rgIFNγrel elicits a short-lived priming effect for monocyte ROI production. Cells were treated with medium, rgIFNγ (100 ng/ml), rgIFNγrel (1 ng/ml), or a combination of rgIFNγ (100 ng/ml), and 1 ng/ml of rgIFNγrel, alone or in conjuction with 5 μg/ml of α-rgIFNγrel IgG. All experiments were conducted as described above using monocytes from cultures established from individual fish (n = 5). Statistical analysis was performed using one-way ANOVA, and the results were deemed to be significant at p < 0.05. (*) denotes significantly different (p < 0.05) from the respective medium-treated controls and (+) denotes significantly different from respective treatments (rgIFNγ or rgTNFα2) without rgIFNγrel (p < 0.05). (^) denotes significantly different from respective treatments without antibody application.
FIGURE 4.
FIGURE 4.
Recombinant goldfish IFNγrel induces higher monocyte phagocytic responses compared with rgIFNγ. Goldfish monocyte cultures were treated with medium, rgIFNγ (100 ng/ml), or rgIFNγrel (1, 100 ng/ml) and phagocytosis assessed by FACS. A, representative phagocytosis histogram plots of cells from an individual fish treated with medium, rgIFNγ, or rgIFNγrel. B, mean + S.E. phagocytic response of monocytes obtained from cultures established from individual fish (n = 5) that have ingested 3 or more beads following treatment with medium, rgIFNγ (100 ng/ml), rgIFNγrel (1, 100 ng/ml), a combination of rgIFNγ (100 ng/ml) and rgIFNγrel (100 ng/ml), or rgIFNγrel (100 ng/ml) in conjuction with 5 μg/ml of α-rgIFNγrel IgG. Statistical analysis was done using one-way ANOVA. (*) denotes statistically different (p < 0.05) from medium control. (+) denotes statistically significant (p < 0.05) from rgIFNγ-induced phagocytosis values.
FIGURE 5.
FIGURE 5.
Recombinant goldfish IFNγrel induces higher macrophage iNOS gene expression and nitric oxide production compared with rgIFNγ. A, Q-PCR analysis of gene expression of iNOS isoforms A and B in goldfish macrophages treated with medium, rgIFNγrel (100 ng/ml), rgIFNγ (100 ng/ml), or both recombinant cytokines (100 ng/ml of each protein). Gene expression was performed using the delta CT method against the endogenous control, elongation factor 1 α (EF-1α). The results are mean ± S.E. RQ values for macrophages obtained from cultures established from individual fish (n = 5) and normalized against the RQ values from medium-treated cells. B, nitrite production by cytokine stimulated goldfish macrophages. Macrophages were obtained from cultures established from individual fish (n = 5) and were treated with medium, rgIFNγ (100 ng/ml), rgIFNγrel (1, 10, 100 ng/ml) or a combination of rgIFNγ (100 ng/ml) and rgIFNγrel (100 ng/ml), or rgIFNγrel (100 ng/ml) in conjunction with 5 μg/ml of α-rgIFNγrel IgG. Nitric oxide production was determined using the Griess reaction and nitrite concentration was calculated using a nitrite standard curve. The results are mean ± S.E. μm nitrite. Statistical analysis was done using one-way ANOVA. (*) denotes statistically different (p < 0.05) from medium controls. (+) denotes significant difference (p < 0.05) from rgIFNγ-treated cells.
FIGURE 6.
FIGURE 6.
Analysis of rgIFNγrel and rgIFNγ cellular association, Stat1 tyrosine phosphorylation and phospho-(Y)-Stat1 nuclear accumulation in monocytes treated with rgIFNγrel or rgIFNγ. Five million monocytes were incubated with either medium alone, 5 μg of rgIFNγrel or 5 μg of rgIFNγ for 0, 15, 30, or 90 min. Whole cell lysates (A) were assayed by Western blot using α-polyHis antibody. Cells were also co-incubated with 5 μg of rgIFNγrel and 5 μg of rgIFNγ for a half-hour (B). The relative amounts of rgIFNγrel and rgIFNγ added to cells can be seen in C. Five million monocytes were incubated with either medium, 100 ng/ml of rgIFNγrel, or 100 ng/ml of rgIFNγ for 0, 15, 30, or 90 min. Whole cell lysates (D) or isolated nuclei (E) were assessed by Western blot with an α-phospho-(Tyr)-Stat1 antibody.
FIGURE 7.
FIGURE 7.
Quantitative expression analysis of goldfish IRFs in monocytes treated with medium, 100 ng/ml of rgIFNγrel or 100 ng/ml of rgIFNγ for 0, 15, 30, or 90 min. The reported expression was relative to EF-1α. The genes examined included: (A) IRF-1; (B) IRF-2; (C) IRF-5; (D) IRF-7; (E) IRF-8; (F) IRF-9. The expression data were normalized against expression of respective IRFs at the 0 min time point. The results are mean ± S.E. RQ values for monocytes obtained from cultures established from individual fish (n = 5). Statistical analysis was performed using one-way ANOVA, and the results were deemed to be significant at p < 0.05. (*) denotes significantly different (p < 0.05) from the respective 0 time point control.

Similar articles

Cited by

References

    1. Mosmann T. R., Coffman R. L. (1989) Annu. Rev. Immunol. 7, 145–173 - PubMed
    1. Sad S., Marcotte R., Mosmann T. R. (1995) Immunity 2, 271–279 - PubMed
    1. Perussia B. (1991) Curr. Opin. Immunol. 3, 49–55 - PubMed
    1. Wheelock E. F. (1965) Science 149, 310–311 - PubMed
    1. Staeheli P. (1990) Adv. Virus. Res. 38, 147–200 - PubMed

Publication types