. 2010 Aug 6;285(32):24360-71.
doi: 10.1074/jbc.M110.115964. Epub 2010 May 27.

Pulsatile and sustained gonadotropin-releasing hormone (GnRH) receptor signaling: does the ERK signaling pathway decode GnRH pulse frequency?

Affiliations

Pulsatile and sustained gonadotropin-releasing hormone (GnRH) receptor signaling: does the ERK signaling pathway decode GnRH pulse frequency?

Stephen P Armstrong et al. J Biol Chem. .

Abstract

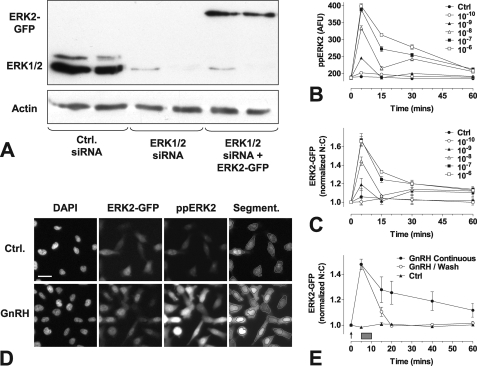
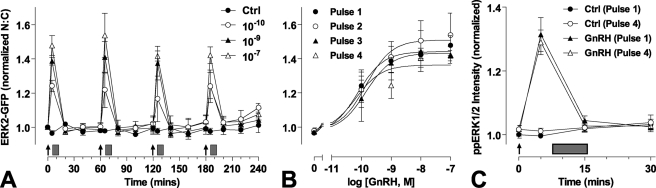
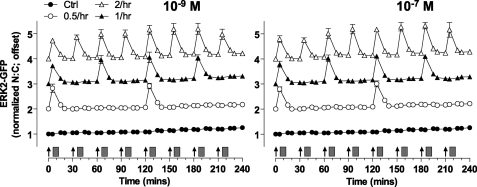
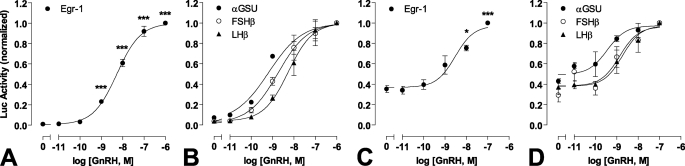
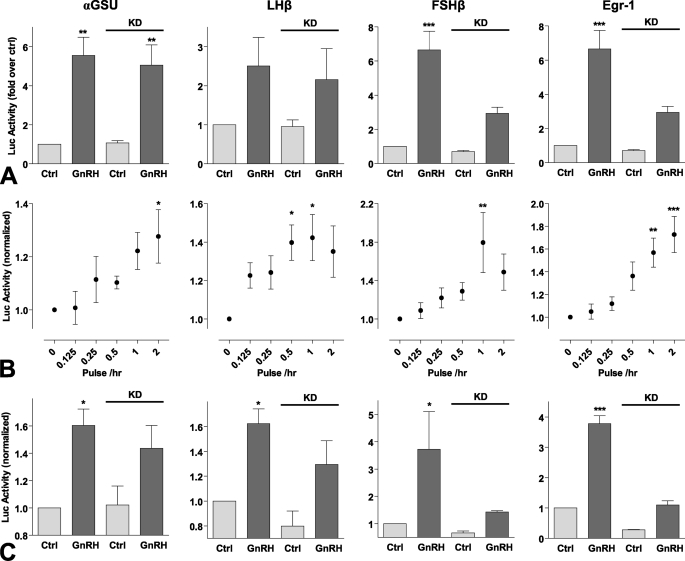
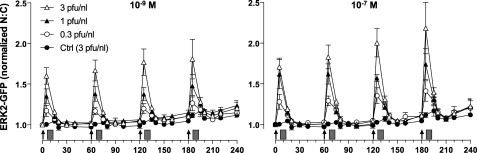
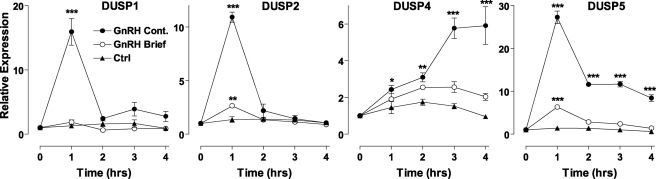
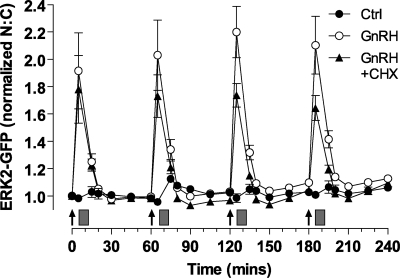
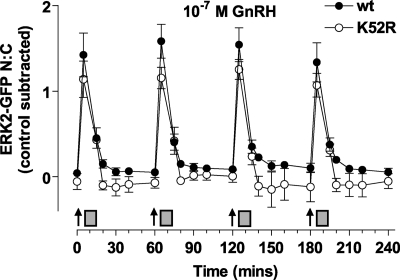
Gonadotropin-releasing hormone (GnRH) acts via G-protein-coupled receptors on gonadotrophs to stimulate synthesis and secretion of luteinizing hormone and follicle-stimulating hormone. It is secreted in pulses, and its effects depend on pulse frequency, but decoding mechanisms are unknown. Here we have used an extracellular signal regulated kinase-green fluorescent protein (ERK2-GFP) reporter to monitor GnRH signaling. GnRH caused dose-dependent ERK2-GFP translocation to the nucleus, providing a live-cell readout for activation. Pulsatile GnRH caused dose- and frequency-dependent ERK2-GFP translocation. These responses were rapid and transient, showed only digital tracking, and did not desensitize under any condition tested (dose, frequency, and receptor number varied). We also tested for the effects of cycloheximide (to prevent induction of nuclear-inducible MAPK phosphatases) and used GFP fusions containing ERK mutations (D319N, which prevents docking domain-dependent binding to MAPK phosphatases, and K52R, which prevents catalytic activity). These manipulations had little or no effect on the translocation responses, arguing against a role for MAPK phosphatases or ERK-mediated feedback in shaping ERK activation during pulsatile stimulation. GnRH also caused dose- and frequency-dependent activation of the alpha-gonadotropin subunit-, luteinizing hormone beta-, and follicle-stimulating hormone beta- luciferase reporters, and the latter response was inhibited by ERK1/2 knockdown. Moreover, GnRH caused frequency-dependent activation of an Egr1-luciferase reporter, but the response was proportional to cumulative pulse duration. Our data suggest that frequency decoding is not due to negative feedback shaping ERK signaling in this model.


Figures

FIGURE 1.
FIGURE 1.
Image-based assays of GnRH-mediated ERK signaling. Panel A, HeLa cells were grown in 6-well plates, transfected with control siRNAs (Ctrl) or ERK1/2 siRNAs, and transduced with Ad mGnRHR with or without Ad ERK2-GFP as indicated. Cells were processed for Western blotting with antibodies targeting total ERK1/2 or β-actin, as described under “Experimental Procedures.” The position of bands showing ERK1/2 and ERK2-GFP were determined by comparison with molecular weight markers. Results are representative of three similar experiments. Panels B and C, cells were plated in 96-well plates and subject to siRNA knockdown of ERK1/2 then transduced with Ad-mGnRHR and Ad-ERK2-GFP before serum starvation overnight. Cells were stimulated with GnRH at the indicated times and molar concentrations before fixation, immunocytochemical staining, and image analysis as described under “Experimental Procedures.” Panel D, cells were treated as above, and representative images are shown before and after treatment with GnRH (10−6 m, peak response shown) for the ppERK2 and ERK2-GFP image channels, with an example of the automated image segmentation. Scale bar, 30 μm. Panel E, cells were plated as above, then stained with Hoechst dye and treated with 10−7 m GnRH at the indicated time points either continuously or for 5 min followed by repeated wash (gray rectangle). Live cell image acquisition and analysis was performed as described under “Experimental Procedures.” Data shown are ppERK fluorescence intensity in arbitrary fluorescence units (AFU) or N:C ratio of ERK2-GFP fluorescence intensity (background subtracted) normalized as the -fold change over control. Results shown are the mean ± S.E. of 3–8 independent experiments. For panel E, statistical analysis by two-way ANOVA indicates that treatment type (brief versus sustained) is a significant source of variation (p < 0.001, F1,68 = 22.49), as is time (p < 0.001, F5,68 = 30.32), and the interaction (p < 0.05, F5,68 = 2.92).
FIGURE 2.
FIGURE 2.
ERK2 responses during pulsatile GnRH treatment. Cells were transduced with Ad-mGnRHR and Ad-ERK2-GFP after knockdown of endogenous ERK1/2 then serum-starved overnight. Panels A and B, cells were stained with Hoechst dye and treated with the indicated concentrations of GnRH at 0, 60, 120, and 180 min (arrows) for 5 min followed by repeated wash steps (gray rectangles). Live cell image acquisition and analysis was performed as described under “Experimental Procedures.” Panel C, cells were pretreated with 10−7 m GnRH (for 5 min, followed by wash) or with control (Ctrl) at hourly intervals for 3 h and then stimulated with a final 5-min pulse of GnRH. During the last pulse cells were fixed at the indicated time points, and immunocytochemical staining for ppERK1/2 was performed. Data shown are the N:C ratio of ERK2-GFP fluorescence intensity (background subtracted) or ppERK2 fluorescence intensity, normalized as the -fold change over control. Results shown are the mean ± S.E. of 3–4 independent experiments, performed in duplicate wells. For panel B, curve fitting reveals log EC50 values in the range of −10.2 to −9.8, and two-way ANOVA reveals that GnRH concentration is a significant source of variation (p < 0.01, F4,48 = 32.82), whereas pulse number is not (p = 0.44, F3,48 = 0.91).
FIGURE 3.
FIGURE 3.
Live cell imaging with varied GnRH pulse frequency. Cells were subject to siRNA knockdown of ERK1/2 and transduced with Ad-NLS-BFP, Ad-mGnRHR, and Ad-ERK2-GFP before serum starvation overnight. Cells were treated (for 5 min) with 10−7 or 10−9 m GnRH at 30-min, 1 h, or every 2 h as indicated. As a control (Ctrl), all wells were subject to half-hourly washes (gray rectangles) 5 min after the GnRH addition. Live cell image acquisition and analysis was performed as described under “Experimental Procedures.” Data shown are the N:C ratio of ERK2-GFP fluorescence intensity (background subtracted), normalized as the -fold change over control (at 0 min) and offset by +1, 2, or 3 (for 0.5-, 1-h, and 2-h intervals, respectively). Results shown are the mean ± S.E. of three independent experiments.
FIGURE 4.
FIGURE 4.
Dose response relationships of transcriptional reporters with sustained and pulsatile GnRH treatment. Cells were transfected with αGSU-Luc, LHβ-Luc, FSHβ-Luc, or Egr1-Luc plasmids and transduced with Ad-mGnRHR. Cells were treated with indicated concentration of GnRH for 8 h either continuously (panels A and B) or briefly for 5 min at hourly intervals (panels C and D). The data shown are luciferase activity in relative luminescence units (RLU) normalized to the maximum response. Results shown are the mean ± S.E. of at 3 or 4 independent experiments, performed in triplicate wells. Panels A and C, significant differences are indicated using one-way ANOVA and Bonferroni's post-hoc test, comparing untreated control versus agonist treated; *, p < 0.05; **, p < 0.01; ***, p < 0.001.
FIGURE 5.
FIGURE 5.
ERK dependence and frequency response relationships of transcriptional reporters with pulsatile GnRH treatment. Cells were transduced with Ad-αGSU-Luc, Ad-LHβ-Luc, Ad-FSHβ-Luc, or Ad-Egr1-Luc and Ad-mGnRHR. Where indicated (panels A and C) cells were subject to siRNA knockdown (KD) of ERK1/2 48 h before stimulation. Panel A, cells were treated with 10−7 m GnRH or control (Ctrl) for 8 h continuously. Panel B, cells were briefly treated (for 5 min followed by repeated wash steps) with 10−9 m GnRH at the indicated frequency (with half-hourly washes as a control) for 8 h. Panel C, cells were briefly treated with 10−7 m GnRH or control at hourly intervals. The data shown are luciferase activity (in RLU) normalized to the control. Results shown are the mean ± S.E. of 3–7 independent experiments, performed in triplicate wells. Panel A, two-way ANOVA reveals that GnRH treatment is a significant source of variation (p < 0.05) for all reporters, whereas siRNA knockdown (and interaction; p < 0.05) is a significant variable for both FSHβ-Luc and Egr1-Luc (both p < 0.01). Panel B, significant differences are indicated using one-way ANOVA and Bonferroni's post-hoc test, comparing untreated control versus agonist treated. Panel C, two-way ANOVA reveals that GnRH treatment is a significant source of variation (p < 0.05) for all reporters, whereas siRNA knockdown and the interaction is a significant variable for Egr1-Luc (both p < 0.001). Significant differences are indicated using Bonferroni's post-hoc test; *, p < 0.05; **, p < 0.01; ***, p < 0.001.
FIGURE 6.
FIGURE 6.
Influence of GnRH receptor number on ERK2-GFP translocation responses to pulsatile stimulation. Cells were subject to siRNA knockdown of ERK1/2 and transduced with Ad-NLS-BFP, Ad-ERK2-GFP, and 0.3, 1, or 3 pfu/nl Ad-mGnRHR before serum starvation overnight. Cells were treated with the indicated concentrations of GnRH at 0, 60, 120, and 180 min for 5 min followed by repeated wash as indicated (gray rectangles). Live cell image acquisition and analysis was performed as described under “Experimental Procedures.” Data shown are the N:C ratio of ERK2-GFP fluorescence intensity (background subtracted), normalized as the -fold change over control (at 0 min). Results shown are the mean ± S.E. of three independent experiments, performed in duplicate wells.
FIGURE 7.
FIGURE 7.
Nuclear-inducible DUSP mRNA expression after brief or sustained GnRH treatment. Cells were plated in 6-well plates, serum-starved overnight, then treated for 4 h with 10−7 m GnRH either continuously or with GnRH or control for 5 min. Total RNA was isolated and analyzed for relative levels of DUSP1, -2, -4, or -5 mRNA using quantitative PCR as described under “Experimental Procedures.” Data shown are normalized values (mean ± S.E.) obtained from three independent experiments, each with duplicate readings. Significant differences are indicated, comparing untreated control versus treated using one-way ANOVA and Bonferroni's post-hoc test; *, p < 0.05; **, p < 0.01; ***, p < 0.001.
FIGURE 8.
FIGURE 8.
Effect of mutated D319N-ERK2 and CHX on ERK2-GFP translocation. Cells were subject to siRNA knockdown of ERK1/2 and transduced with Ad-mGnRHR, Ad-NLS-BFP, and Ad-ERK2-GFP. They were treated with 10−7 m GnRH at 0, 60, 120, and 180 min for 5 min followed by repeated washes (gray rectangles); where indicated the cells were pretreated with 30 μm CHX for 20 min, and CHX remained present during wash steps. Live cell image acquisition and analysis was performed as described under “Experimental Procedures.” Data shown are the N:C ratio of ERK2-GFP fluorescence intensity (background subtracted), normalized as the -fold change over control (Ctrl, at 0 min). Results shown are the mean ± S.E. of 3–6 independent experiments, performed in duplicate wells. The relevant controls (without GnRH treatment) in each experiment were pooled as no significant differences were observed. Statistical analysis is by repeated-measure ANOVA and Bonferroni's Multiple Comparison Test. CHX-treated peak responses at 125 and 185 min are significantly different from the corresponding peaks with GnRH treatment alone (p < 0.01).
FIGURE 9.
FIGURE 9.
Effect of K52R mutant on ERK2-GFP translocation after pulsatile GnRH treatment. Cells were subject to siRNA knockdown of ERK1/2 and transduced with Ad-mGnRHR, Ad-NLS-BFP, and Ad-ERK2-GFP (wt) or mutated K52R-ERK2-GFP as indicated. Cells were treated with 10−7 m GnRH at 0, 60, 120, and 180 min for 5 min followed by repeated wash as indicated (gray rectangles). Live cell image acquisition and analysis was performed as described under “Experimental Procedures.” Data shown is the N:C ratio of ERK2-GFP fluorescence intensity with the relevant time-matched control values subtracted. Results shown are the mean ± S.E. of three independent experiments, performed in duplicate wells.

References

    1. Millar R. P., Lu Z. L., Pawson A. J., Flanagan C. A., Morgan K., Maudsley S. R. (2004) Endocr. Rev. 25, 235–275 - PubMed
    1. Burger L. L., Haisenleder D. J., Dalkin A. C., Marshall J. C. (2004) J. Mol. Endocrinol. 33, 559–584 - PubMed
    1. Naor Z. (2009) Front. Neuroendocrinol. 30, 10–29 - PubMed
    1. Ferris H. A., Shupnik M. A. (2006) Biol. Reprod. 74, 993–998 - PubMed
    1. Belchetz P. E., Plant T. M., Nakai Y., Keogh E. J., Knobil E. (1978) Science 202, 631–633 - PubMed

Publication types

MeSH terms

LinkOut - more resources