. 2010 Jul 30;285(31):23699-710.
doi: 10.1074/jbc.M110.123497. Epub 2010 May 27.

p21-activated kinase 4 phosphorylation of integrin beta5 Ser-759 and Ser-762 regulates cell migration

Affiliations

p21-activated kinase 4 phosphorylation of integrin beta5 Ser-759 and Ser-762 regulates cell migration

Zhilun Li et al. J Biol Chem. .

Abstract

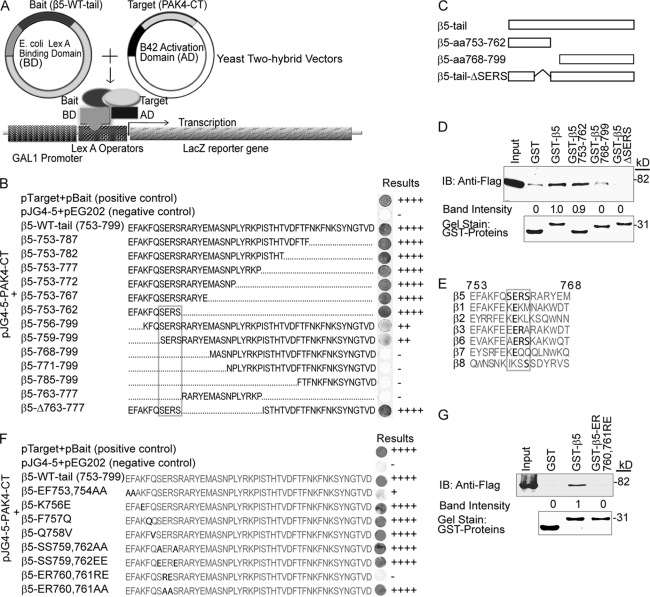
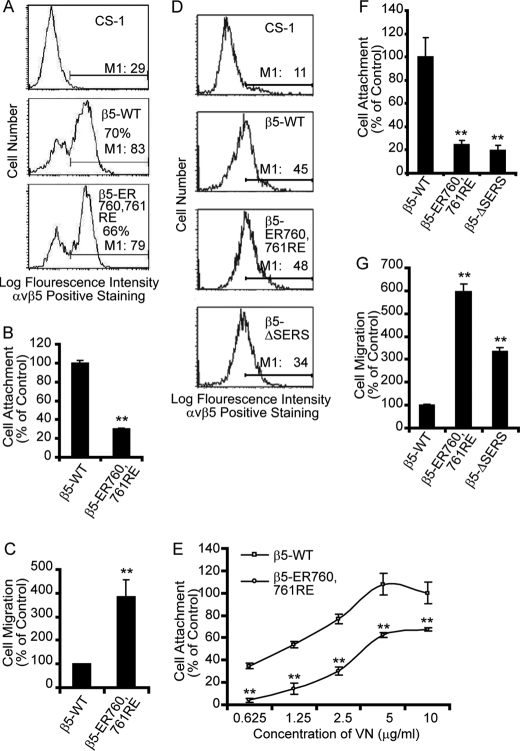
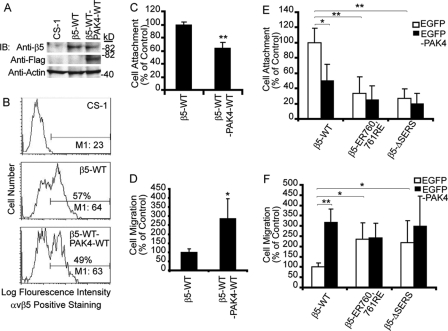
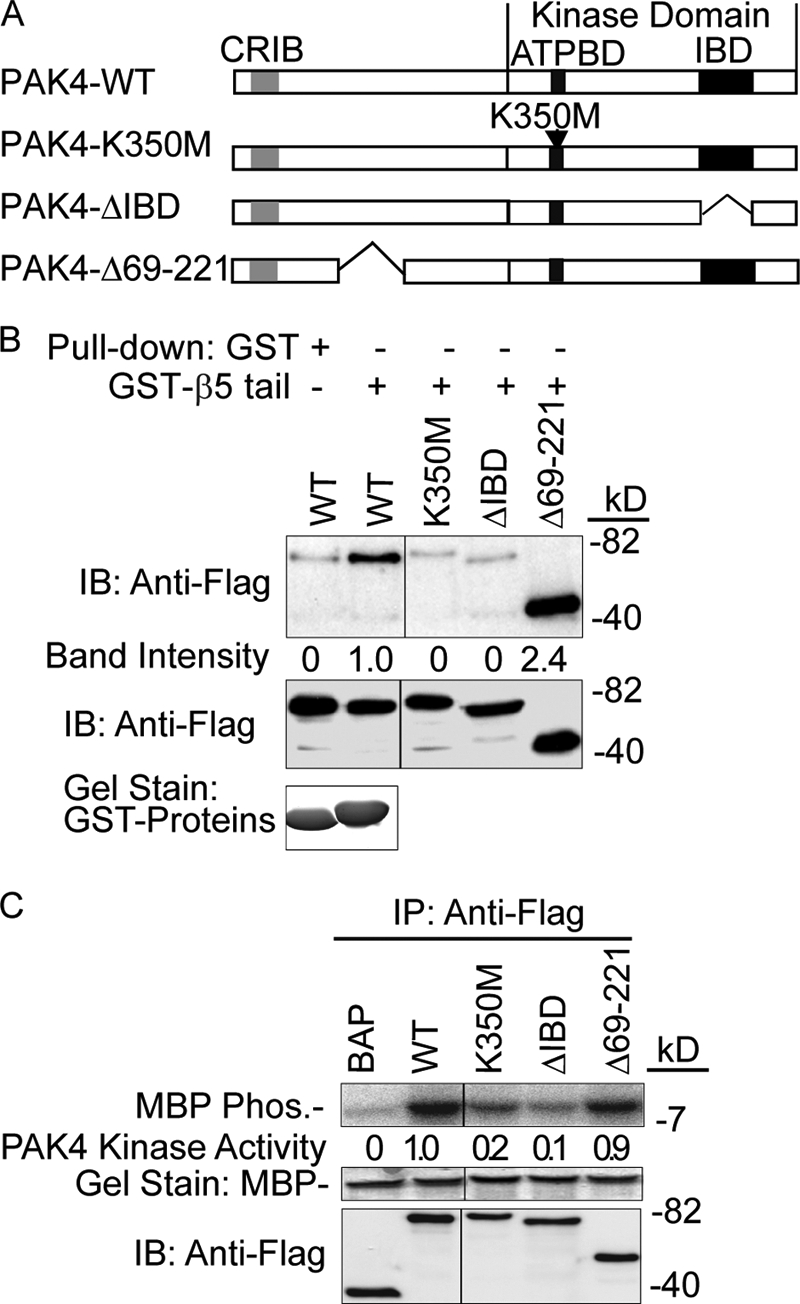
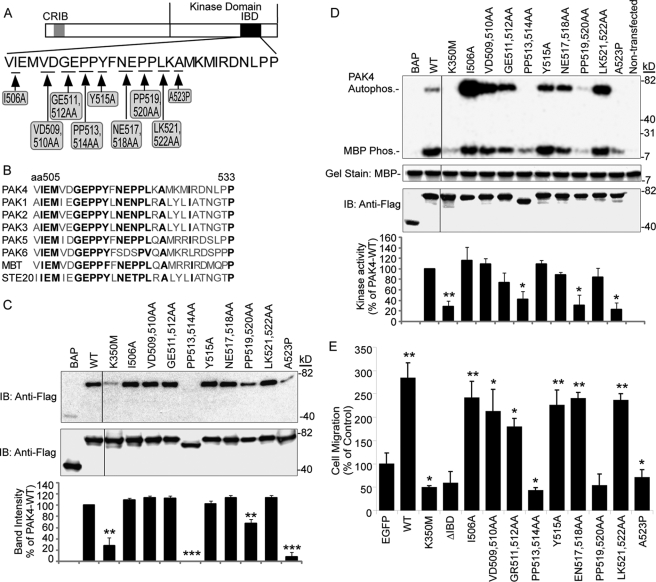
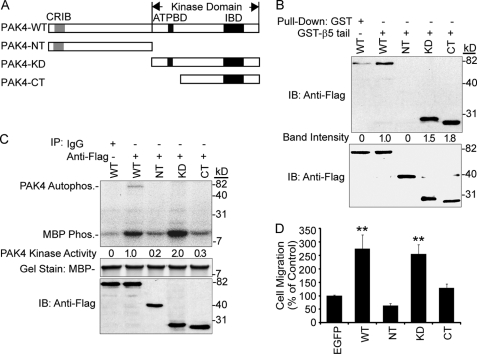
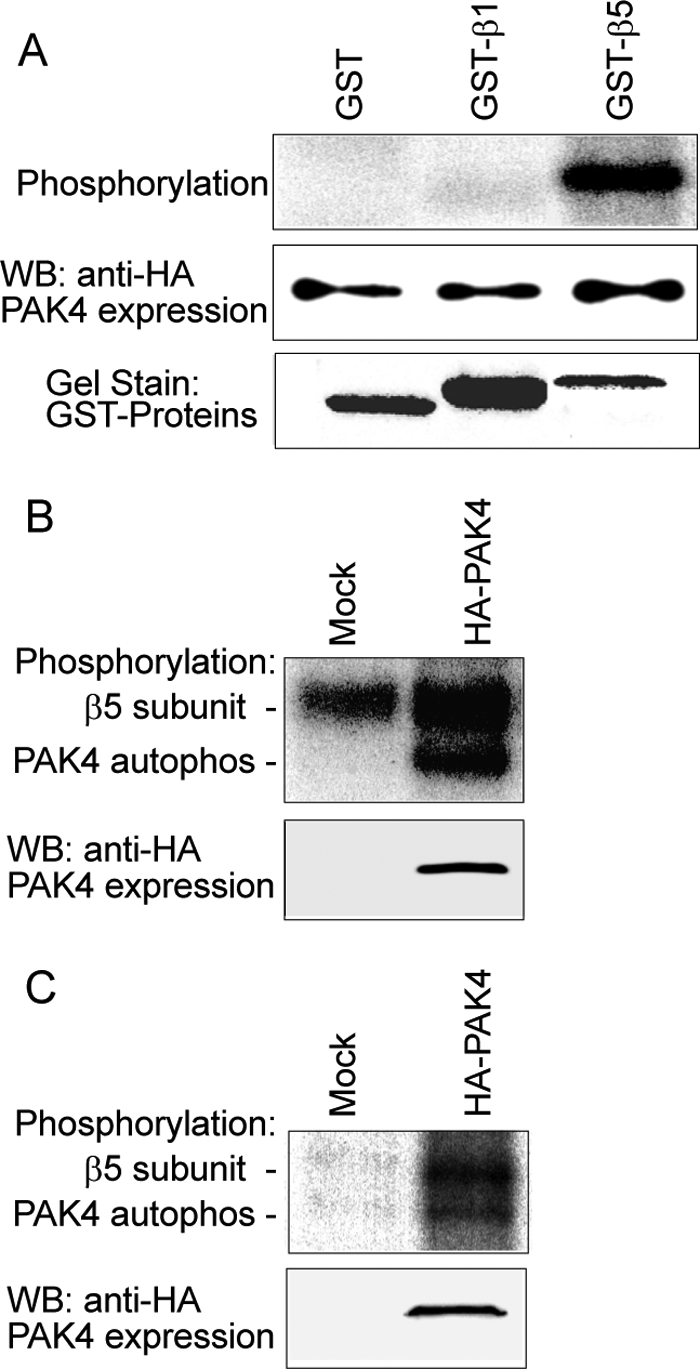
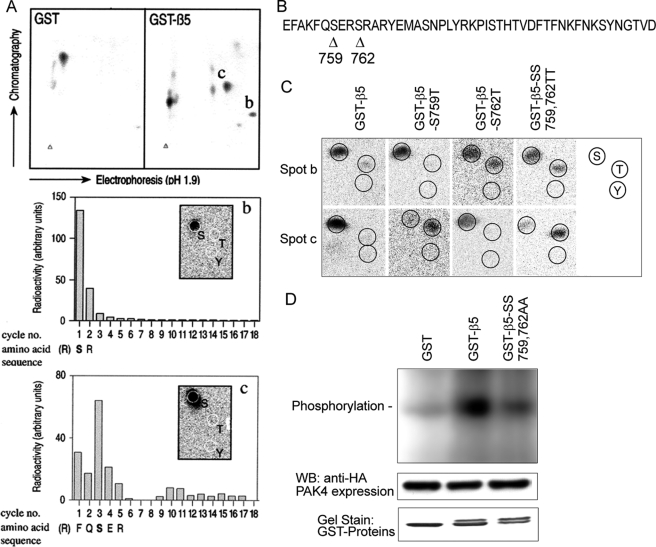
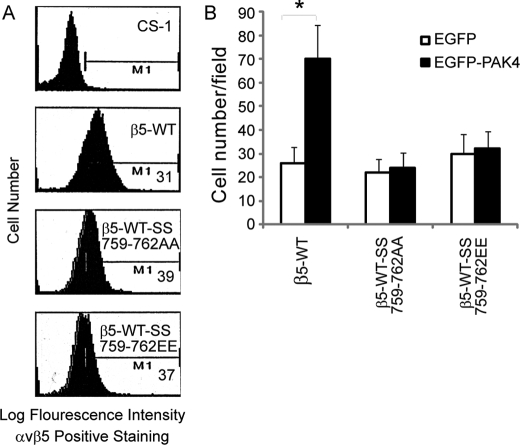
Modulation of integrin alphavbeta5 regulates vascular permeability, angiogenesis, and tumor dissemination. In addition, we previously found a role for p21-activated kinase 4 (PAK4) in selective regulation of integrin alphavbeta5-mediated cell motility (Zhang, H., Li, Z., Viklund, E. K., and Strömblad, S. (2002) J. Cell Biol. 158, 1287-1297). This report focuses on the molecular mechanisms of this regulation. We here identified a unique PAK4-binding membrane-proximal integrin beta5-SERS-motif involved in controlling cell attachment and migration. We also mapped the integrin beta5-binding site within PAK4. We found that PAK4 binding to integrin beta5 was not sufficient to promote cell migration, but that PAK4 kinase activity was required for PAK4 promotion of cell motility. Importantly, PAK4 specifically phosphorylated the integrin beta5 subunit at Ser-759 and Ser-762 within the beta5-SERS-motif. Point mutation of these two serine residues abolished the PAK4-induced cell migration, indicating a functional role for these phosphorylations in migration. Our results may give important leads to the functional regulation of integrin alphavbeta5, with implications for vascular permeability, angiogenesis, and cancer dissemination.


Figures

FIGURE 1.
FIGURE 1.
Identification of an integrin β5 SERS-motif in PAK4 binding. A, schematic diagram of the yeast two-hybrid system used in Fig. 1. B, yeast two-hybrid mating test assay. The integrin β5-tail (aa 753–799) and fragments thereof were mated with PAK4-CT. The strength of the interactions judged by the intensity of blue after 48 h is indicated on the far right. C, the schematic diagram shows the GST-integrin β5 tail and the β5 fragments used in the GST pulldown assay in panel D. D, GST pulldown assay of PAK4-WT using GST-integrin β5-tail and fragments thereof (upper panel). Pulldown of PAK4-WT using GST alone served as a negative control. The input lane using a lysate of PAK4 WT-transfected cells marks the size of PAK4-WT. The relative band intensities are indicated below. Coomassie Brilliant Blue gel staining shows the loading of GST proteins (lower panel). E, an alignment of partial amino acids sequences of integrin β cytoplasmic tails with the corresponding regions of the integrin β5 PAK4-binding motif. The SERS-motif and conserved amino acid within are in bold. F, the indicated integrin β5-tail point mutations were introduced within the PAK4-binding region, and the resulting products were mated with PAK4-CT as described in A–B. G, GST pulldown of PAK4-WT using GST, GST-β5-tail, and GST-β5-ER760,761RE mutants. The input lanes show the position of PAK4-WT by direct immunoblot of lysate (upper panel). The relative band intensities are displayed below. Coomassie Brilliant Blue gel staining shows the loading of GST fusion proteins (lower panel). Displayed results are representative of three or more experiments.
FIGURE 2.
FIGURE 2.
Mutation or deletion of the integrin β5 tail SERS-motif affects cell attachment and migration. A, the integrin αvβ5 cell surface expression levels of CS-1 cells transiently transfected with integrin β5-WT or β5-ER760,761RE were analyzed by flow cytometry. Non-transfected CS-1 cells served as a control for the FACS settings. The given percentages represent the fraction of cells displaying αvβ5-staining above untransfected CS-1 cells, and M1 shows mean intensity of the cells expressing αvβ5. These cells were then used for cell attachment and migration assays. B and C, bar graphs show quantification of cell attachment (B) or cell migration (C) on VN of CS-1 cells transiently expressing integrin β5-WT or β5-ER760,761RE, where β5-WT-expressing cells are defined as control. D, flow cytometry analysis of integrin αvβ5 cell surface expression in CS-1 cells with or without stable expression of integrin β5 or mutants thereof. M1 is the mean intensity of the cells expressing αvβ5. E and F, cell attachment and (G) motility on VN of CS-1 cells stably expressing integrin β5 or indicated β5 mutants. E, cell attachment onto different VN-coating concentrations and (F) to VN-coating using 2.5 μg/ml. Bars represent mean values ± S.E. (B, C, F, G) or S.D. (E) (n = 3). Statistically discernable differences as determined by t test are indicated (**, p ≤ 0.01). Displayed results are representative of three or more experiments.
FIGURE 3.
FIGURE 3.
The PAK4-binding integrin β5 tail SERS-motif regulates cell attachment and migration. A and B, the expression levels of CS-1 cells transiently transfected with integrin β5-WT or co-transfected with integrin β5-WT and FLAG-PAK4-WT analyzed by immunoblotting (A) or flow cytometry (B) with untransfected CS-1 cells as negative control and actin as a loading control. Percentages and M1 values are as shown as in Fig. 2. C, cell attachment and (D) cell motility on VN (10 μg/ml) of CS-1 cells transiently transfected with β5-WT or co-transfected with integrin β5-WT and PAK4-WT. E, cell attachment and (F) cell motility on VN of stable clones of CS-1-β5-WT, CS-1-β5-ER760,761RE, and CS-1-β5-ΔSERS transiently co-expressing EGFP (open bars) or EGFP-PAK4 (solid bars). Parental CS-1 cells transfected with EGFP or EGFP-PAK4 served as background control (not shown). Values obtained with CS-1-β5-WT co-transfected with EGFP empty vector were defined as control. Bars represent mean values ± S.E. (n = 3). Statistically discernable differences as determined by t test are indicated (*, p ≤ 0.05; **, p ≤ 0.01). Displayed results are representative of three or more experiments.
FIGURE 4.
FIGURE 4.
Mapping of the integrin β5 binding region within PAK4 and the role of the IBD for PAK4 kinase activity. A, the schematic diagram shows the domain composition of PAK4 and the PAK4 mutants used in this figure. CRIB denotes the Cdc42- and Rac-binding domain. The ATP-binding domain (ATPBD) and the integrin-binding domain (IBD) are situated within the kinase domain (KD) of PAK4. B, GST pulldown assay of PAK4 mutants. Cell lysates from COS-7 cells transiently expressing FLAG-tagged WT PAK4 (WT), PAK4-ΔIBD, PAK4-K350M, or PAK4-Δ69–221 were pulled down by a GST-β5-WT-tail fusion protein (top panel). PAK4-WT in combination with GST was used as a negative control (top panel). The quantified relative band intensities are shown below. The middle panel shows the used amounts of overexpressed PAK4 analyzed by immunoblotting (IB). Coomassie Brilliant Blue gel staining shows the relative amount of GST fusion proteins (lower panel). C, PAK4 kinase assay. Immunoprecipitates from COS-7 cells transiently transfected with PAK4 constructs were used in an in vitro kinase assay using myelin basic protein (MBP) as a substrate (top panel). The kinase activities of PAK4 mutants were quantified using a PhosphorImager, and numbers relative to WT PAK4 activity for MBP phosphorylation are indicated below. FLAG-BAP was used as a negative control. The middle panel shows Coomassie Brilliant Blue gel staining of MBP loading, and the lower panel shows loading of overexpressed proteins detected by immunoblot (IB).
FIGURE 5.
FIGURE 5.
Mapping of the PAK4 integrin-binding site at the amino acid level and function of PAK4-IBD point mutations for PAK4 kinase activity and cell migration. A, the schematic diagram shows the PAK4 point mutations created within the PAK4 IBD. B, alignment of the integrin-binding motif of PAK4 with the corresponding regions of human PAKs, the Drosophila PAK4 homologue mushroom bodies tiny (MBT) gene and yeast STE20. Amino acids in bold show conservation among the PAKs, which was used as the basis for the PAK4-IBD point mutation design. C, GST-β5-tail pulldown of lysates from COS-7 cells transfected with FLAG-tagged full-length PAK4 and point mutants thereof as indicated (top panel). FLAG-BAP was used as a negative control. Immunoblotting shows loading of FLAG-tagged proteins (middle panel). The migration rate of the mutant PP513,534AA protein consistently appeared higher than other mutants. This may be caused by proteolysis as a result of the mutagenesis. The relative band intensity of pulled down PAK4 is indicated in the lower bar graph, and the band intensity was set to 0 for the FLAG-BAP control and100% of control for PAK4-WT. Bars represent mean intensity ± S.E. among three experiments. Statistically discernable differences compared with PAK4-WT according to t test are indicated (**, p ≤ 0.01; ***, p ≤ 0.001). D, FLAG-tagged proteins were analyzed in a kinase assay using MBP as a substrate (top panel). The FLAG-BAP and lysate of non-transfected COS-7 cells were used as negative controls. Coomassie Brilliant Blue gel staining shows the loading of MBP (upper middle panel), and immunoblotting shows the loading of FLAG-tagged proteins (lower middle panel). The relative activities quantified by PhosphorImager are shown in the lower panel (bar graph) for PAK4 MBP substrate phosphorylation activity. The kinase activity was set to 0 for the FLAG-BAP control and 100% of control for PAK4-WT. Bars represent mean values ± S.E. for three distinct experiments. Statistically discernable differences compared with PAK4-WT according to t test are indicated (*, p ≤ 0.05; **, p ≤ 0.01). E, MCF-7 cells transiently transfected with control EGFP, EGFP-PAK4 WT, or EGFP-PAK4 mutants as indicated were analyzed for haptotactic cell motility toward VN. Bar graphs show quantified cell motility relative to the EGFP control (mean value ± S.E. of at least three experiments). Statistically discernable differences compared with EGFP control according to t test are indicated (*, p ≤ 0.05; **, p ≤ 0.01).
FIGURE 6.
FIGURE 6.
Elucidation of the role of PAK4 integrin binding capacity for cell motility. A, schematic diagram shows common structural features of PAK4 and the PAK4 mutations: PAK4-NT (aa 1–322), PAK4-KD (aa 323–591), and PAK4-CT (aa 396–591). B, GST pulldown assay of PAK4 mutants. Cell lysates from COS-7 cells transiently expressing FLAG-tagged WT PAK4 (WT), PAK4-NT, PAK4-KD, or PAK4-CT were pulled down by a GST-β5-tail fusion protein (top panel). PAK4-WT in combination with GST was used as a negative control (top panel). The quantified relative band intensities are shown below. Lower panel shows the loading of overexpressed PAK4 analyzed by immunoblotting (IB). The GST fusion protein relative amounts used are shown in Fig. 4B. C, PAK4 kinase assay. Immunoprecipitates from COS-7 cells transiently transfected with FLAG-tagged PAK4-WT, PAK4-NT, PAK4-KD, or PAK4-CT were used in an in vitro kinase assay using myelin basic protein (MBP) as a substrate (top panel). PAK4-WT in combination with a normal mouse IgG was used as a negative control. The kinase activities of PAK4 mutants were quantified using a PhosphorImager, and the numbers relative to WT PAK4 activity for MBP phosphorylation are indicated below. The middle panel shows Coomassie Brilliant Blue gel staining of MBP loading, and the lower panel shows loading of overexpressed proteins detected by immunoblot (IB). D, cell migration assays of PAK4 mutants. MCF-7 cells were transiently transfected with control EGFP, EGFP-PAK4-WT, EGFP-PAK4-NT, EGFP-PAK4-KD, or EGFP-PAK4-CT mutants. The data represent the mean for three separate experiments ± S.E. Statistically discernable differences compared with EGFP control analyzed by t test are indicated (*, p ≤ 0.05; **, p ≤ 0.01).
FIGURE 7.
FIGURE 7.
PAK4 phosphorylates the integrin β5 subunit. PAK4 was immunoprecipitated using an anti-HA mAb from COS-7 cells transfected with an HA-PAK4 vector and incubated with integrins in the presence of [γ-32P]ATP. A, PAK4 phosphorylation of integrin β5 cytoplasmic domain analyzed by in vitro phosphorylation using purified GST, GST-β1, or GST-β5 cytoplasmic domain as substrates. PAK4 levels detected by immunoblot (middle panel) and the amounts of GST fusion proteins used are indicated by staining with Coomassie Brilliant Blue (lower panel). B, in the same manner, 5 μg of purified integrin αvβ5 was analyzed for phosphorylation by immunoprecipitated PAK4, separated by 7.5% SDS-PAGE, and visualized by autoradiography. C, PAK4 phosphorylates β5 subunit in living cells. Cells underwent phosphate starvation and then metabolic labeling as described under “Experimental Procedures.” Integrin αvβ5 was immunoprecipitated in cells with or without overexpressed HA-PAK4, exposed to SDS-PAGE and autoradiography (upper panel). The lower panel shows the immunoblot for HA-PAK4 expression.
FIGURE 8.
FIGURE 8.
Mapping of PAK4 phosphorylation sites within the integrin β5 cytoplasmic domain. A, PAK4-phosphorylated GST-β5 was separated by two-dimensional-gel electrophoresis after trypsin digestion. Spots marked with b and c appeared consistently in the same location in different experiments and did not occur in the GST control. These two spots were further analyzed by phosphopeptide mapping and identified as serines 759 and 762 (middle and bottom panels). The inset shows results of phosphoamino acid analysis. B, arrowheads point out the two PAK4-induced phosphorylation sites within the integrin β5 membrane-proximal region at serine residues 759 and 762. C, phosphoamino acid content of peptides from spots b and c, analyzed from GST-β5-WT, GST-β5-S759T, GST-β5-S762T, and GST-β5-SS759,762TT, and GST fusion proteins were phosphorylated in vitro by PAK4. Migrating positions of phospho amino acid markers are shown in the panel to the right. D, the two phosphorylation sites at Ser-759 and Ser-762 were mutated to alanine residues to further elucidate the identity of the two phosphorylatable residues. PAK4 phosphorylation of GST-β5 was compared with GST and the GST-β5 alanine mutant.
FIGURE 9.
FIGURE 9.
Integrin β5 serines 759 and/or 762 are necessary for PAK4 induced cell migration. A, flow cytometry analysis of integrin αvβ5 cell surface expression in CS-1 cells with or without stable expression of integrin β5-WT, β5-SS759,762AA, or β5-SS759,762EE. M1 shows mean intensity of the cells expressing αvβ5. B, cell migration onto VN of stable mixed clones of β5-WT, β5-SS759,762AA, and β5-SS759,762AA transiently co-expressing EGFP (open bars) or EGFP-PAK4 (solid bars). Bars represent mean values ± S.E. for three experiments. Statistically discernable differences as determined by t test are indicated (*, p ≤ 0.05).

Similar articles

Cited by

References

    1. Zhang H., Li Z., Viklund E. K., Strömblad S. (2002) J. Cell Biol. 158, 1287–1297 - PMC - PubMed
    1. Hynes R. O. (2002) Cell 110, 673–687 - PubMed
    1. Liddington R. C., Ginsberg M. H. (2002) J. Cell Biol. 158, 833–839 - PMC - PubMed
    1. Kim M., Carman C. V., Springer T. A. (2003) Science 301, 1720–1725 - PubMed
    1. Miranti C. K., Brugge J. S. (2002) Nat. Cell Biol. 4, E83–E90 - PubMed

Publication types