

A genome-wide map of human genetic interactions inferred from radiation hybrid genotypes
- PMID: 20508145
- PMCID: PMC2909575
- DOI: 10.1101/gr.104216.109
A genome-wide map of human genetic interactions inferred from radiation hybrid genotypes
Abstract
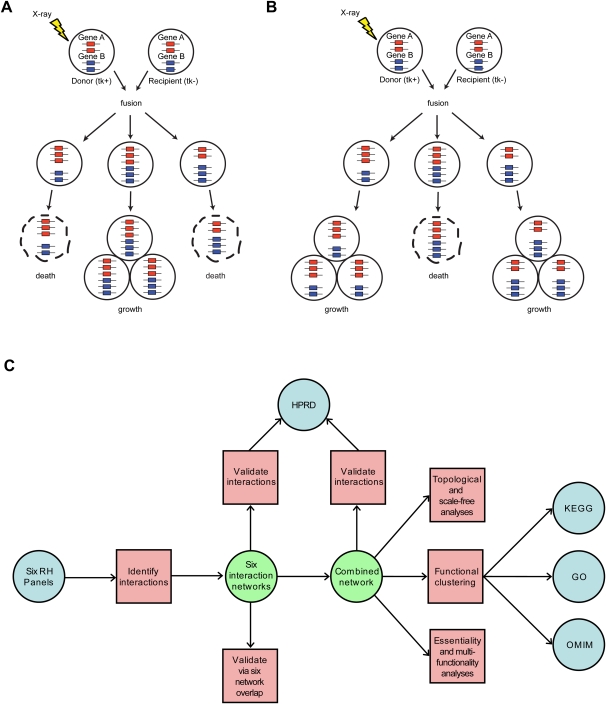
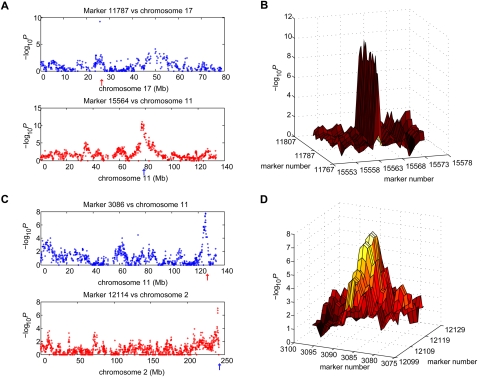
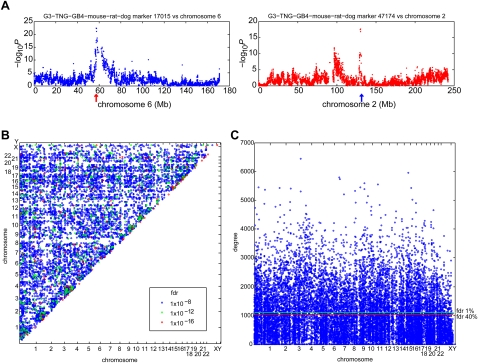
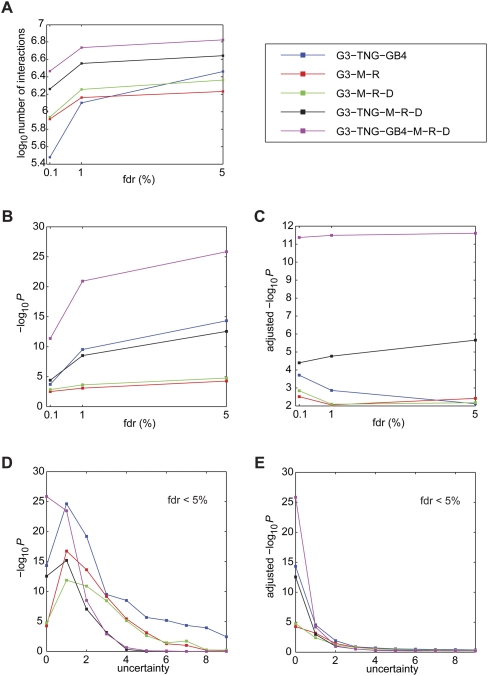
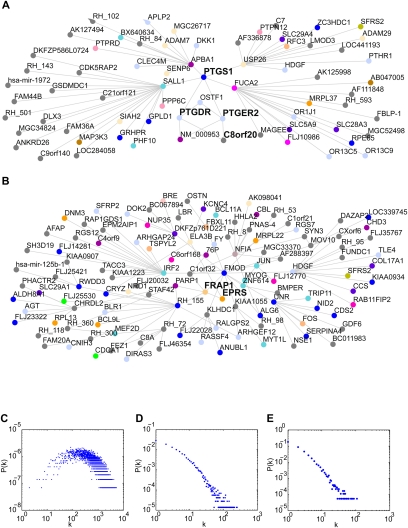
Using radiation hybrid genotyping data, 99% of all possible gene pairs across the mammalian genome were tested for interactions based on co-retention frequencies higher (attraction) or lower (repulsion) than chance. Gene interaction networks constructed from six independent data sets overlapped strongly. Combining the data sets resulted in a network of more than seven million interactions, almost all attractive. This network overlapped with protein-protein interaction networks on multiple measures and also confirmed the relationship between essentiality and centrality. In contrast to other biological networks, the radiation hybrid network did not show a scale-free distribution of connectivity but was Gaussian-like, suggesting a closer approach to saturation. The radiation hybrid (RH) network constitutes a platform for understanding the systems biology of the mammalian cell.
Figures
Similar articles
-
Mammalian genes preferentially co-retained in radiation hybrid panels tend to avoid coexpression.PLoS One. 2012;7(2):e32284. doi: 10.1371/journal.pone.0032284. Epub 2012 Feb 24. PLoS One. 2012. PMID: 22384204 Free PMC article.
-
Directed mammalian gene regulatory networks using expression and comparative genomic hybridization microarray data from radiation hybrids.PLoS Comput Biol. 2009 Jun;5(6):e1000407. doi: 10.1371/journal.pcbi.1000407. Epub 2009 Jun 12. PLoS Comput Biol. 2009. PMID: 19521529 Free PMC article.
-
High-resolution mapping of cancer cell networks using co-functional interactions.Mol Syst Biol. 2018 Dec 20;14(12):e8594. doi: 10.15252/msb.20188594. Mol Syst Biol. 2018. PMID: 30573688 Free PMC article.
-
Charting the genetic interaction map of a cell.Curr Opin Biotechnol. 2011 Feb;22(1):66-74. doi: 10.1016/j.copbio.2010.11.001. Epub 2010 Nov 24. Curr Opin Biotechnol. 2011. PMID: 21111604 Review.
-
Biological impacts and context of network theory.J Exp Biol. 2007 May;210(Pt 9):1548-58. doi: 10.1242/jeb.003731. J Exp Biol. 2007. PMID: 17449819 Review.
Cited by
-
Single-cell analysis of gene expression in the substantia nigra pars compacta of a pesticide-induced mouse model of Parkinson's disease.Transl Neurosci. 2022 Sep 1;13(1):255-269. doi: 10.1515/tnsci-2022-0237. eCollection 2022 Jan 1. Transl Neurosci. 2022. PMID: 36117858 Free PMC article.
-
Genetic interaction networks: better understand to better predict.Front Genet. 2013 Dec 17;4:290. doi: 10.3389/fgene.2013.00290. Front Genet. 2013. PMID: 24381582 Free PMC article. Review.
-
Cost-Effective Mapping of Genetic Interactions in Mammalian Cells.Front Genet. 2021 Aug 5;12:703738. doi: 10.3389/fgene.2021.703738. eCollection 2021. Front Genet. 2021. PMID: 34434222 Free PMC article.
-
Interactomic exploration of LRRC8A in volume-regulated anion channels.Cell Death Discov. 2024 Jun 22;10(1):299. doi: 10.1038/s41420-024-02032-0. Cell Death Discov. 2024. PMID: 38909013 Free PMC article.
-
Mammalian genes preferentially co-retained in radiation hybrid panels tend to avoid coexpression.PLoS One. 2012;7(2):e32284. doi: 10.1371/journal.pone.0032284. Epub 2012 Feb 24. PLoS One. 2012. PMID: 22384204 Free PMC article.
References
-
- Albert R, Barabasi AL 2002. Statistical mechanics of complex networks. Rev Mod Phys 74: 47–97
-
- Avner P, Bruls T, Poras I, Eley L, Gas S, Ruiz P, Wiles MV, Sousa-Nunes R, Kettleborough R, Rana A, et al. 2001. A radiation hybrid transcript map of the mouse genome. Nat Genet 29: 194–200 - PubMed
Publication types
MeSH terms
Grants and funding
LinkOut - more resources
Full Text Sources