

Enhancing effects of flavored nutritive stimuli on cortical swallowing network activity
- PMID: 20508154
- PMCID: PMC2928539
- DOI: 10.1152/ajpgi.00161.2010
Enhancing effects of flavored nutritive stimuli on cortical swallowing network activity
Abstract
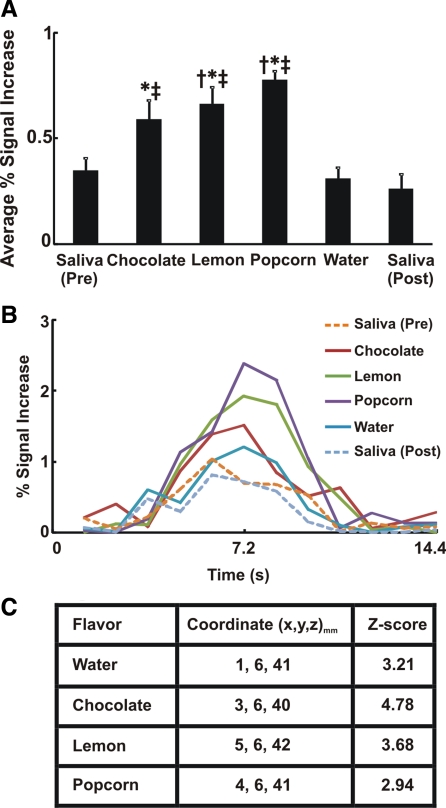
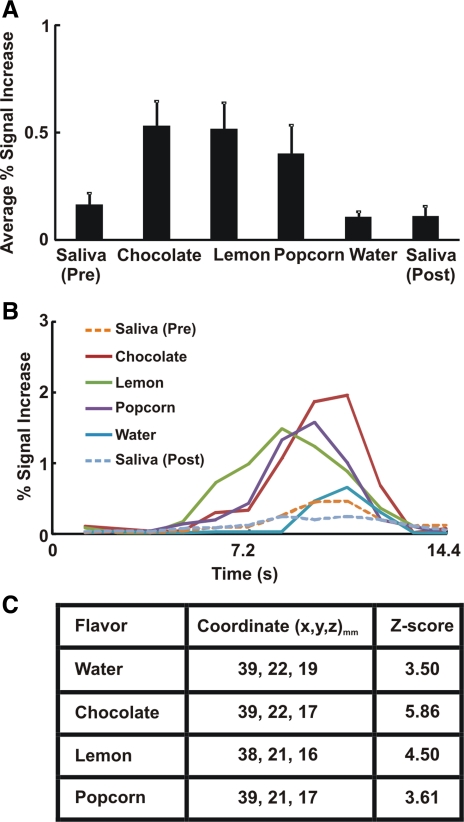
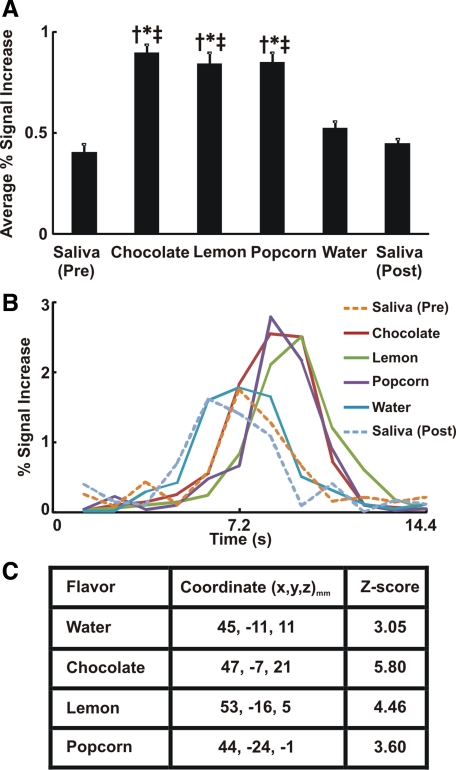
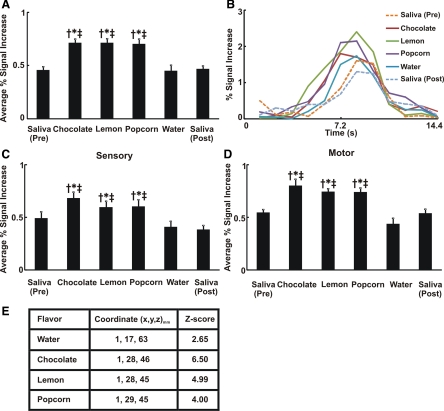
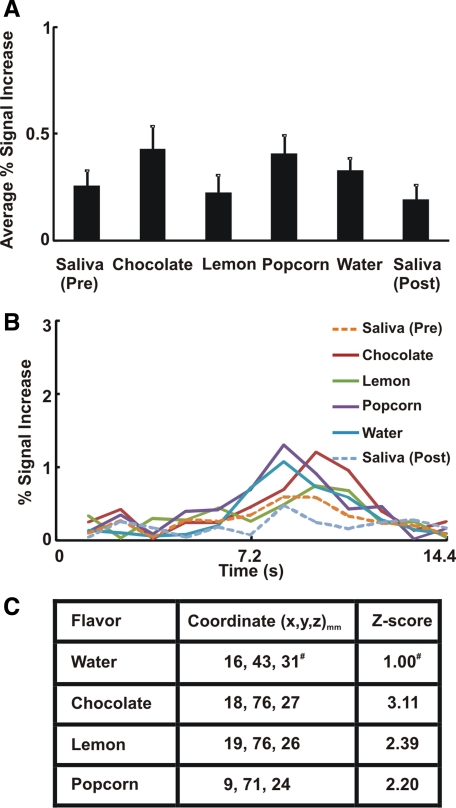
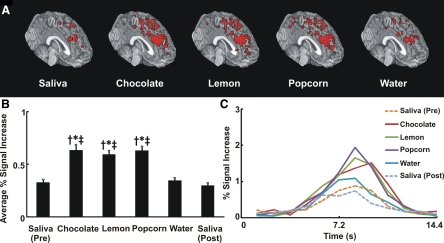
A better understanding of the central control of the physiology of deglutition is necessary for devising interventions aimed at correcting pathophysiological conditions of swallowing. Positive modulation of the cortical swallowing network can have clinical ramifications in dysphagia due to central nervous system deficits. Our aim was to determine the effect of nutritive sensory input on the cortical swallowing network. In 14 healthy right-handed volunteers, we utilized a paradigm-driven protocol to quantify the number of activated voxels and their signal intensity within the left hemispheric cortical swallowing network by high-resolution functional MRI (fMRI) during five different swallowing conditions. Swallowing conditions included a dry swallow (saliva) and natural water-, lemon-, popcorn-, and chocolate-flavored liquid swallows. Each flavored liquid was presented simultaneously by its image, scent, and taste in random order and tested over three runs. fMRIs were analyzed in a blinded fashion. Average fMRI blood oxygenation level-dependent signal intensity and number of activated voxels during swallowing concurrent with nutritive gustatory, olfactory, and visual stimulations were significantly increased compared with dry/natural water swallows throughout the cortical swallowing network (P < 0.001 and P < 0.05, respectively). Subregion analysis showed the increased activity for flavored liquids in prefrontal, cingulate gyrus, and sensory/motor cortex, but not in precuneus and insula. Concurrent gustatory, olfactory, and visual nutritive stimulation enhances the activity of the cortical swallowing network. This finding may have clinical implications in management of swallowing disorders due to cortical lesions.
Figures
Similar articles
-
Effect of esophageal acid exposure on the cortical swallowing network in healthy human subjects.Am J Physiol Gastrointest Liver Physiol. 2009 Jul;297(1):G152-8. doi: 10.1152/ajpgi.00062.2009. Epub 2009 Apr 30. Am J Physiol Gastrointest Liver Physiol. 2009. PMID: 19407219 Free PMC article.
-
Cerebral cortical representation of reflexive and volitional swallowing in humans.Am J Physiol Gastrointest Liver Physiol. 2001 Mar;280(3):G354-60. doi: 10.1152/ajpgi.2001.280.3.G354. Am J Physiol Gastrointest Liver Physiol. 2001. PMID: 11171617 Clinical Trial.
-
Cortical representation of swallowing in normal adults: functional implications.Laryngoscope. 1999 Sep;109(9):1417-23. doi: 10.1097/00005537-199909000-00011. Laryngoscope. 1999. PMID: 10499047
-
Cortical input in control of swallowing.Curr Opin Otolaryngol Head Neck Surg. 2009 Jun;17(3):166-71. doi: 10.1097/MOO.0b013e32832b255e. Curr Opin Otolaryngol Head Neck Surg. 2009. PMID: 19369872 Review.
-
[Insula, a "mysterious" island in our brain -- minireview].Orv Hetil. 2010 Nov 21;151(47):1924-9. doi: 10.1556/OH.2010.29004. Orv Hetil. 2010. PMID: 21071302 Review. Hungarian.
Cited by
-
Molecular and Neural Mechanism of Dysphagia Due to Cancer.Int J Mol Sci. 2021 Jun 29;22(13):7033. doi: 10.3390/ijms22137033. Int J Mol Sci. 2021. PMID: 34210012 Free PMC article. Review.
-
Sour taste increases swallowing and prolongs hemodynamic responses in the cortical swallowing network.J Neurophysiol. 2016 Nov 1;116(5):2033-2042. doi: 10.1152/jn.00130.2016. Epub 2016 Aug 3. J Neurophysiol. 2016. PMID: 27489363 Free PMC article.
-
Functional MRI of swallowing: from neurophysiology to neuroplasticity.Head Neck. 2011 Oct;33 Suppl 1(0 1):S14-20. doi: 10.1002/hed.21903. Epub 2011 Sep 7. Head Neck. 2011. PMID: 21901779 Free PMC article.
-
Effect of carbonated beverages on pharyngeal swallowing in young individuals and elderly inpatients.Dysphagia. 2014 Apr;29(2):213-22. doi: 10.1007/s00455-013-9493-6. Epub 2013 Oct 30. Dysphagia. 2014. PMID: 24170038
-
The Role of the Corpus Callosum in Pediatric Dysphagia: Preliminary Findings from a Diffusion Tensor Imaging Study in Children with Unilateral Spastic Cerebral Palsy.Dysphagia. 2017 Oct;32(5):703-713. doi: 10.1007/s00455-017-9816-0. Epub 2017 Jun 8. Dysphagia. 2017. PMID: 28597327
References
-
- Ardran GM, Kemp FH. Closure and opening of the larynx during swallowing. Br J Radiol 29: 205–208, 1956 - PubMed
-
- Asoh R, Goyal RK. Manometry and electromyography of the upper esophageal sphincter in the opossum. Gastroenterology 74: 514–520, 1978 - PubMed
-
- Baylis LL, Rolls ET, Baylis GC. Afferent connections of the caudolateral orbitofrontal cortex taste area of the primate. Neuroscience 64: 801–812, 1995 - PubMed
-
- Birn RM, Bandettini PA, Cox RW, Jesmanowicz A, Shaker R. Magnetic field changes in the human brain due to swallowing or speaking. Magn Reson Med 40: 55–60, 1998 - PubMed
-
- Car A. [Macrophysiological and microphysiological study of the deglutition area of the frontal cortex.] (Abstract). J Physiol (Paris) 63: 183A, 1971 - PubMed
Publication types
MeSH terms
Grants and funding
LinkOut - more resources
Full Text Sources