Variation in colonization, ADP-ribosylating and vacuolating cytotoxin, and pulmonary disease severity among mycoplasma pneumoniae strains
- PMID: 20508214
- PMCID: PMC2949405
- DOI: 10.1164/rccm.201001-0080OC
Variation in colonization, ADP-ribosylating and vacuolating cytotoxin, and pulmonary disease severity among mycoplasma pneumoniae strains
Abstract
Rationale: Mycoplasma pneumoniae was recently discovered to produce an ADP-ribosylating and vacuolating cytotoxin, designated CARDS toxin, which is hypothesized to be a primary pathogenic mechanism responsible for M. pneumoniae-induced pulmonary inflammation. It is unknown if cytotoxin production varies with M. pneumoniae strain or if variation in cytotoxin production affects pulmonary disease severity.
Objectives: To examine the production of CARDS toxin by various strains of M. pneumoniae and compare the disease manifestations elicited by these strains in an experimental model of M. pneumoniae respiratory infection.
Methods: BALB/c mice were inoculated once intranasally with SP4 broth (negative control) or three different M. pneumoniae strains: M129-B7, M129-B9, or S1. Mice were assessed at 1, 2, 4, 7, 10, and 14 days after inoculation. Outcome variables included comparisons among M. pneumoniae strains relative to bronchoalveolar lavage (BAL) M. pneumoniae quantitative culture, CARDS toxin-based PCR, and CARDS toxin protein determinations, as well as cytokine and chemokine concentrations. Graded lung histopathologic score (HPS) was also assessed.
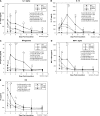
Measurements and main results: CARDS toxin concentrations were significantly increased in mice inoculated with strain S1 compared with mice inoculated with M129-B7 or M129-B9 strains. Quantitative M. pneumoniae culture and polymerase chain reaction were also significantly greater in mice infected with S1 strain compared with the other two strains, as were lung HPS and concentrations of IFN-γ, IL-12, IL-1α, macrophage inflammatory protein-1α, and keratinocyte-derived chemokine. In addition, a significant positive correlation was found between CARDS toxin concentration and lung HPS.
Conclusions: CARDS toxin concentrations in BAL are directly linked to the ability of specific M. pneumoniae strains to colonize, replicate, and persist, and elicit lung histopathology. This variation among strains may predict the range in severity of pulmonary disease observed among patients.
Figures


Similar articles
-
Mycoplasma pneumoniae Community Acquired Respiratory Distress Syndrome toxin expression reveals growth phase and infection-dependent regulation.Mol Microbiol. 2010 Jun 1;76(5):1127-41. doi: 10.1111/j.1365-2958.2010.07092.x. Epub 2010 Feb 28. Mol Microbiol. 2010. PMID: 20199607 Free PMC article.
-
Synthesis and distribution of CARDS toxin during Mycoplasma pneumoniae infection in a murine model.J Infect Dis. 2011 Nov 15;204(10):1596-604. doi: 10.1093/infdis/jir557. Epub 2011 Sep 28. J Infect Dis. 2011. PMID: 21957154 Free PMC article.
-
Intranasal interleukin-12 therapy inhibits Mycoplasma pneumoniae clearance and sustains airway obstruction in murine pneumonia.Infect Immun. 2008 Feb;76(2):732-8. doi: 10.1128/IAI.00878-07. Epub 2007 Nov 26. Infect Immun. 2008. PMID: 18039833 Free PMC article.
-
Exploring the pathogenicity of Mycoplasma pneumoniae: Focus on community-acquired respiratory distress syndrome toxins.Microb Pathog. 2024 Oct;195:106865. doi: 10.1016/j.micpath.2024.106865. Epub 2024 Aug 15. Microb Pathog. 2024. PMID: 39153578 Review.
-
Pathogenesis of Mycoplasma pneumoniae: An update.Indian J Med Microbiol. 2016 Jan-Mar;34(1):7-16. doi: 10.4103/0255-0857.174112. Indian J Med Microbiol. 2016. PMID: 26776112 Review.
Cited by
-
Disulfide bond of Mycoplasma pneumoniae community-acquired respiratory distress syndrome toxin is essential to maintain the ADP-ribosylating and vacuolating activities.Cell Microbiol. 2019 Aug;21(8):e13032. doi: 10.1111/cmi.13032. Epub 2019 May 9. Cell Microbiol. 2019. PMID: 30977272 Free PMC article.
-
Mycoplasma iowae: relationships among oxygen, virulence, and protection from oxidative stress.Vet Res. 2015 Mar 21;46(1):36. doi: 10.1186/s13567-015-0170-7. Vet Res. 2015. PMID: 25880161 Free PMC article.
-
Clinical characteristics of infections caused by Mycoplasma pneumoniae P1 genotypes in children.Eur J Clin Microbiol Infect Dis. 2018 Jul;37(7):1265-1272. doi: 10.1007/s10096-018-3243-5. Epub 2018 Mar 30. Eur J Clin Microbiol Infect Dis. 2018. PMID: 29603035
-
Cellular vacuoles induced by Mycoplasma pneumoniae CARDS toxin originate from Rab9-associated compartments.PLoS One. 2011;6(7):e22877. doi: 10.1371/journal.pone.0022877. Epub 2011 Jul 29. PLoS One. 2011. PMID: 21829543 Free PMC article.
-
Mycoplasma pneumoniae P1 Genotype Indicates Severity of Lower Respiratory Tract Infections in Children.J Clin Microbiol. 2021 Jul 19;59(8):e0022021. doi: 10.1128/JCM.00220-21. Epub 2021 Jul 19. J Clin Microbiol. 2021. PMID: 33980654 Free PMC article.
References
-
- Esposito S, Cavagna R, Bosis S, Droghetti R, Faelli N, Principi N. Emerging role of Mycoplasma pneumoniae in children with acute pharyngitis. Eur J Clin Microbiol Infect Dis 2002;21:607–610. - PubMed
-
- Block S, Hedrick J, Hammerschlag MR, Cassell GH, Craft JC. Mycoplasma pneumoniae and Chlamydia pneumoniae in pediatric community-acquired pneumonia: comparative efficacy and safety of clarithromycin vs. erythromycin ethylsuccinate. Pediatr Infect Dis J 1995;14:471–477. - PubMed
-
- Michelow IC, Olsen K, Lozano J, Rollins NK, Duffy LB, Ziegler T, Kauppila J, Leinonen M, McCracken GH Jr. Epidemiology and clinical characteristics of community-acquired pneumonia in hospitalized children. Pediatrics 2004;113:701–707. - PubMed
-
- Wubbel L, Muniz L, Ahmed A, Trujillo M, Carubelli C, McCoig C, Abramo T, Leinonen M, McCracken GH Jr. Etiology and treatment of community-acquired pneumonia in ambulatory children. Pediatr Infect Dis J 1999;18:98–104. - PubMed
Publication types
MeSH terms
Substances
Grants and funding
LinkOut - more resources
Full Text Sources
Other Literature Sources
Medical
Molecular Biology Databases

