Immunization with a Mixture of HIV Env DNA and VLP Vaccines Augments Induction of CD8 T Cell Responses
- PMID: 20508832
- PMCID: PMC2876254
- DOI: 10.1155/2010/497219
Immunization with a Mixture of HIV Env DNA and VLP Vaccines Augments Induction of CD8 T Cell Responses
Abstract
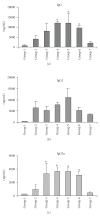
The immune response induced by immunization with HIV Env DNA and virus-like particle (VLP) vaccines was investigated. Immunization with the HIV Env DNA vaccine induced a strong CD8 T cell response but relatively weak antibody response against the HIV Env whereas immunization with VLPs induced higher levels of antibody responses but little CD8 T cell response. Interestingly, immunization with a mixture the HIV Env DNA and VLP vaccines induced enhanced CD8 T cell and antibody responses. Further, it was observed that the mixing of DNA and VLP vaccines during immunization is necessary for augmenting induction of CD8 T cell responses and such augmentation of CD8 T cell responses was also observed by mixing the HIV Env DNA vaccine with control VLPs. These results show that immunization with a mixture of DNA and VLP vaccines combines advantages of both vaccine platforms for eliciting high levels of both antibody and CD8 T cell responses.
Figures


Similar articles
-
The improved antibody response against HIV-1 after a vaccination based on intrastructural help is complemented by functional CD8+ T cell responses.Vaccine. 2016 Apr 4;34(15):1744-51. doi: 10.1016/j.vaccine.2016.02.059. Epub 2016 Mar 3. Vaccine. 2016. PMID: 26945099
-
Virus-Like Particles Displaying Trimeric Simian Immunodeficiency Virus (SIV) Envelope gp160 Enhance the Breadth of DNA/Modified Vaccinia Virus Ankara SIV Vaccine-Induced Antibody Responses in Rhesus Macaques.J Virol. 2016 Sep 12;90(19):8842-54. doi: 10.1128/JVI.01163-16. Print 2016 Oct 1. J Virol. 2016. PMID: 27466414 Free PMC article.
-
Adjuvanting a Simian Immunodeficiency Virus Vaccine with Toll-Like Receptor Ligands Encapsulated in Nanoparticles Induces Persistent Antibody Responses and Enhanced Protection in TRIM5α Restrictive Macaques.J Virol. 2017 Jan 31;91(4):e01844-16. doi: 10.1128/JVI.01844-16. Print 2017 Feb 15. J Virol. 2017. PMID: 27928002 Free PMC article.
-
Enhancement of HIV-1 Env-Specific CD8 T Cell Responses Using Interferon-Stimulated Gene 15 as an Immune Adjuvant.J Virol. 2020 Dec 22;95(2):e01155-20. doi: 10.1128/JVI.01155-20. Print 2020 Dec 22. J Virol. 2020. PMID: 33115866 Free PMC article.
-
Intrastructural help: improving the HIV-1 envelope antibody response induced by virus-like particle vaccines.Curr Opin HIV AIDS. 2017 May;12(3):272-277. doi: 10.1097/COH.0000000000000358. Curr Opin HIV AIDS. 2017. PMID: 28422791 Review.
Cited by
-
Antibody responses against xenotropic murine leukemia virus-related virus envelope in a murine model.PLoS One. 2011 Apr 6;6(4):e18272. doi: 10.1371/journal.pone.0018272. PLoS One. 2011. PMID: 21494670 Free PMC article.
-
Chemokine-Adjuvanted Plasmid DNA Induces Homing of Antigen-Specific and Non-Antigen-Specific B and T Cells to the Intestinal and Genital Mucosae.J Immunol. 2020 Feb 15;204(4):903-913. doi: 10.4049/jimmunol.1901184. Epub 2020 Jan 8. J Immunol. 2020. PMID: 31915263 Free PMC article.
-
Baculovirus-expressed virus-like particle vaccine in combination with DNA encoding the fusion protein confers protection against respiratory syncytial virus.Vaccine. 2014 Oct 7;32(44):5866-74. doi: 10.1016/j.vaccine.2014.08.045. Epub 2014 Aug 27. Vaccine. 2014. PMID: 25173478 Free PMC article.
-
Stability studies of HIV-1 Pr55gag virus-like particles made in insect cells after storage in various formulation media.Virol J. 2012 Sep 18;9:210. doi: 10.1186/1743-422X-9-210. Virol J. 2012. PMID: 22988963 Free PMC article.
-
Vaccination with Combination DNA and Virus-Like Particles Enhances Humoral and Cellular Immune Responses upon Boost with Recombinant Modified Vaccinia Virus Ankara Expressing Human Immunodeficiency Virus Envelope Proteins.Vaccines (Basel). 2017 Dec 19;5(4):52. doi: 10.3390/vaccines5040052. Vaccines (Basel). 2017. PMID: 29257056 Free PMC article.
References
-
- Cohen J. Clinical research. A setback and an advance on the AIDS vaccine front. Science. 2003;300(5616):28–29. - PubMed
-
- Germain RN, Margulies DH. The biochemistry and cell biology and antigen processing and presentation. Annual Review of Immunology. 1993;11:403–450. - PubMed
-
- Pitisuttithum P, Gilbert P, Gurwith M, et al. Randomized, double-blind, placebo-controlled efficacy trial of a bivalent recombinant glycoprotein 120 HIV-1 vaccine among injection drug users in Bangkok, Thailand. Journal of Infectious Diseases. 2006;194(12):1661–1671. - PubMed
-
- Amara RR, Villinger F, Altman JD, et al. Control of a mucosal challenge and prevention of AIDS by a multiprotein DNA/MVA vaccine. Science. 2001;292(5514):69–74. - PubMed
-
- Barouch DH, et al. Vaccine-elicited immune responses prevent clinical AIDS in SHIV(89.6P)-infected rhesus monkeys. Immunology Letters. 2001;79(1-2):57–61. - PubMed
Grants and funding
LinkOut - more resources
Full Text Sources
Research Materials

