. 2010 May 28:11:287.
doi: 10.1186/1471-2105-11-287.

Colonyzer: automated quantification of micro-organism growth characteristics on solid agar

Affiliations

Colonyzer: automated quantification of micro-organism growth characteristics on solid agar

Conor Lawless et al. BMC Bioinformatics. .

Abstract

Background: High-throughput screens comparing growth rates of arrays of distinct micro-organism cultures on solid agar are useful, rapid methods of quantifying genetic interactions. Growth rate is an informative phenotype which can be estimated by measuring cell densities at one or more times after inoculation. Precise estimates can be made by inoculating cultures onto agar and capturing cell density frequently by plate-scanning or photography, especially throughout the exponential growth phase, and summarising growth with a simple dynamic model (e.g. the logistic growth model). In order to parametrize such a model, a robust image analysis tool capable of capturing a wide range of cell densities from plate photographs is required.

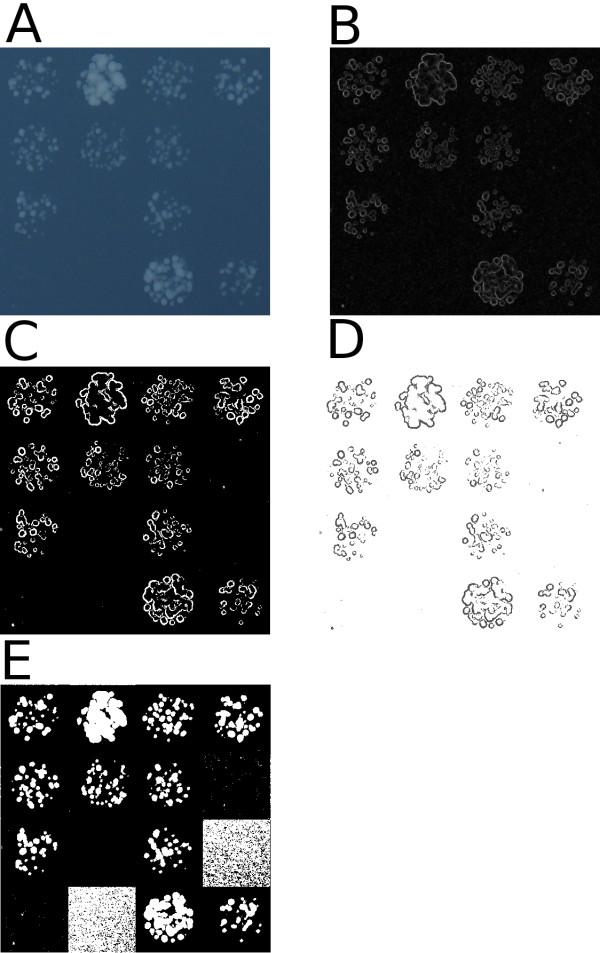
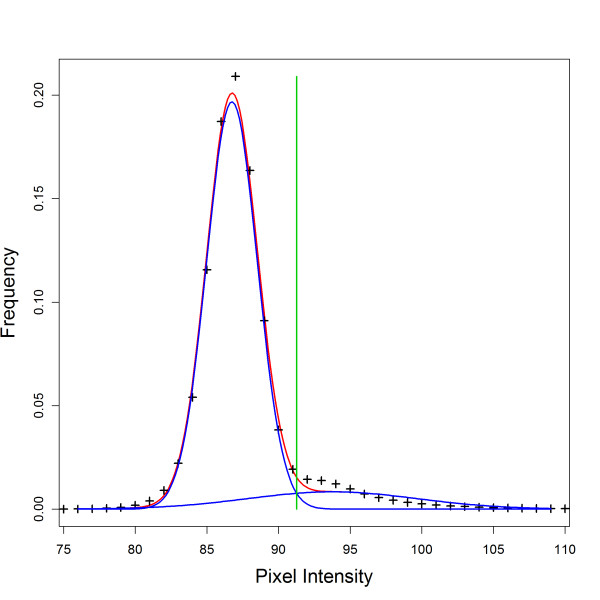
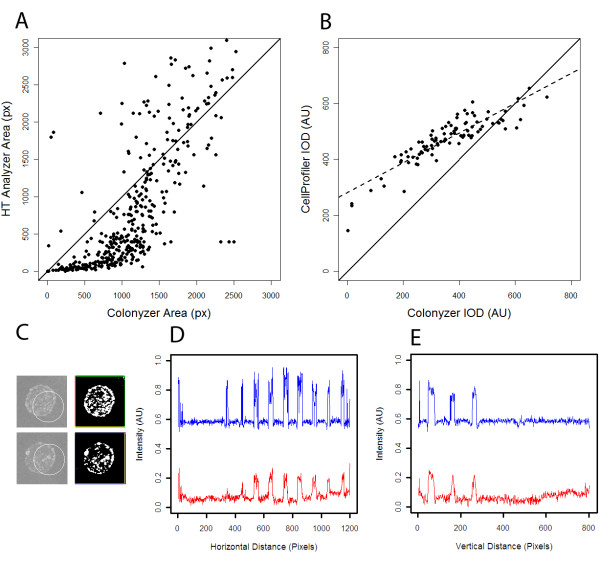
Results: Colonyzer is a collection of image analysis algorithms for automatic quantification of the size, granularity, colour and location of micro-organism cultures grown on solid agar. Colonyzer is uniquely sensitive to extremely low cell densities photographed after dilute liquid culture inoculation (spotting) due to image segmentation using a mixed Gaussian model for plate-wide thresholding based on pixel intensity. Colonyzer is robust to slight experimental imperfections and corrects for lighting gradients which would otherwise introduce spatial bias to cell density estimates without the need for imaging dummy plates. Colonyzer is general enough to quantify cultures growing in any rectangular array format, either growing after pinning with a dense inoculum or growing with the irregular morphology characteristic of spotted cultures. Colonyzer was developed using the open source packages: Python, RPy and the Python Imaging Library and its source code and documentation are available on SourceForge under GNU General Public License. Colonyzer is adaptable to suit specific requirements: e.g. automatic detection of cultures at irregular locations on streaked plates for robotic picking, or decreasing analysis time by disabling components such as lighting correction or colour measures.

Conclusion: Colonyzer can automatically quantify culture growth from large batches of captured images of microbial cultures grown during genome-wide scans over the wide range of cell densities observable after highly dilute liquid spot inoculation, as well as after more concentrated pinning inoculation. Colonyzer is open-source, allowing users to assess it, adapt it to particular research requirements and to contribute to its development.


Figures

Figure 1
Figure 1
Cultures can be spotted or pinned onto agar. A) 16 different S. cerevisiae mutant cultures growing in 384-format on solid agar after inoculation by spotting of dilute liquid inoculum. B) The same 16 mutants, growing in quadruplicate cultures on a different plate in the same location, in 1536-format , inoculated by direct pinning onto agar. Images were simultaneously captured 2 days after inoculation. Mutant specific differences in cell densities are apparent in both images, but more pronounced in panel A.
Figure 2
Figure 2
Logistic growth model fit. A) & B) Logistic model (grey curves) fit to a timecourse of cell density observations (black symbols) for identical S. cerevisiae mutants grown from a dilute liquid inoculated (spotted) culture on solid agar in 384 spot format (open black circles) and from direct pin inoculation (black crosses) in 1536 format at 23°C. Cell density is estimated from IOD using Colonyzer. The logistic model is fully described by the three parameters: G(0), the inoculum cell density, K the carrying capacity or maximum achievable cell density for that culture and r the culture growth rate (d-1). Images were captured manually, in parallel for both inoculation types. A) Observations and model estimates plotted with density on the linear scale. B) Observations and model estimates plotted with density on the log scale. C) Culture photograph timecourses in 384 spotted and 1536 pinned formats corresponding to the data in A) & B). The lower timecourse (1536) format has pinned cultures in quadruplicate. The sum of these four culture densities is represented by the black crosses in panels A) & B).
Figure 3
Figure 3
Colonyzer lighting correction & thresholding. Colonyzer detects cultures with low cell density in liquid-inoculated spots in 384 format. A) Original captured plate image from S&P Robotics [4] BM3-SC, B) Image after lighting correction, C) Thresholded image without prior lighting correction, D) Thresholded image with prior lighting correction. Coloured squares around cultures are tile locations as estimated by Colonyzer. In panels C) & D), white pixels are those classified as being cell cultures, black pixels are classified as being agar. Pixel misclassification on some non-experimental edge colonies in panel D) are artefacts caused by light reflecting from plate walls onto the agar. Colonyzer largely (but not completely) corrects for these artefacts when they occur.
Figure 4
Figure 4
Local thresholding algorithm for fast, sensitive first-pass image segmentation. A) 16 spotted cultures from an example original plate image, B) Sobel gradient map of panel A, C) Mask of top 5% intensity gradients from panel B, D) Mask applied to original image (background set to white) E) Original image intensities locally thresholded by tile to exclude the darkest 33% of pixels from panel D in each tile location
Figure 5
Figure 5
Automatic Thresholding with Gaussian mixed model. Example trimmed image pixel intensity distribution (black crosses), maximum likelihood model estimate for mixed model (red curve), individual Gaussian components modelling agar and culture intensities separately (blue curves) and optimal threshold xThresh (green line) at intersection of the two component distributions. This example histogram represents a plate image with a strong agar signal and a low cell density (culture barely detectable by eye).
Figure 6
Figure 6
Colonyzer corrects spatial lighting gradients. Horizontal and vertical intensity slices from a 384 well plate image with growing S. cerevisiae spots captured on an S&P robotics [4] BM3-SC. Local intensity peaks represent cultures (at low cell density) or plate edges. Blue curves show the lighting-induced intensity gradient before correction. Red curves show a flat intensity gradient after correction, which maintains culture information.
Figure 7
Figure 7
Example Colonyzer input. Some example photographs of S. cerevisiae, S. pombe and E. Coli cultures growing on solid agar with various spotting/pinning formats which are suitable for analysis using Colonyzer. A) Liquid inoculated 384 spot plate, B) 384 spot plate with a coloured drug in the agar, C) 1536 colony plate (pinned), D) 384 spot plate with an agar crack from drying E) Circular petri dish with serial dilution of rectangular gridded E. coli spotted cultures F) 384 spot plate with strongly growing contaminant cut out by hand to prevent overgrowth. Panels D and F are extremely rare worst-case scenarios for experimental plates and are only included to demonstrate that Colonyzer is robust to these features. All of these images (plus more examples) are available for download and testing [12].
Figure 8
Figure 8
Comparison of cell density estimates from different tools. A) HT Colony Analyzer culture area estimate plotted against Colonyzer area estimate for the 384-format Sample4.jpg image from the Colonyzer example image collection hosted on SourceForge. Note that HT Colony Analyzer and several other high-throughput colony quantification tools are not designed to deal with the opacity and irregular morphology of spotted cultures and so this comparison is not completely fair. B) CellProfiler culture IOD estimate plotted against Colonyzer estimate for the 96-format yeast plate example from Figure 2E in Lamprecht et al. [5], downloaded from http://www.cellprofiler.org and analysed using the CellProfiler "Grid of Spots" demonstration pipeline. Pearson's correlation coefficient of 0.89, but with slope of 0.53. C) Two example cultures from the image in panel B with original images together with CellProfiler culture location (designated with a circle) in the left column. The right column shows the equivalent Colonyzer masks defining its estimates of cell locations CellProfiler incorrectly estimates culture location badly in three of the 96 cultures and erroneously trims ~5% of culture edge for almost all cultures. D) & E) Horizontal and vertical intensity slices through bottom and right sides of CellProfiler test image after correction by Colonlyzer (blue curve) and by CellProfiler (red curve).

References

    1. Addinall SG, Downey M, Yu M, Zubko MK, Dewar J, Leake A, Hallinan J, Shaw O, James K, Wilkinson DJ, Wipat A, Durocher D, Lydall D. A Genomewide Suppressor and Enhancer Analysis of cdc13-1 Reveals Varied Cellular Processes Influencing Telomere Capping in Saccharomyces cerevisiae. Genetics. 2008;180:2251–2266. doi: 10.1534/genetics.108.092577. - DOI - PMC - PubMed
    1. Collins SR, Schuldiner M, Krogan NJ, Weissman JS. A strategy for extracting and analyzing large-scale quantitative epistatic interaction data. Genome Biology. 2006;7:R63. doi: 10.1186/gb-2006-7-7-r63. - DOI - PMC - PubMed
    1. Shah NA, Laws RJ, Wardman B, Zhao LP, Hartman JL IV. Accurate, precise modeling of cell proliferation kinetics from time-lapse imaging and automated image analysis of agar yeast culture arrays. BMC Systems Biology. 2007;1:3. doi: 10.1186/1752-0509-1-3. - DOI - PMC - PubMed
    1. S & P Robotics. http://www.sprobotics.com/
    1. Lamprecht MR, Sabatini DM, Chapman AE. CellProfiler: free, versatile software for automated biological image analysis. BioTechniques. 2007;42:71–75. doi: 10.2144/000112257. - DOI - PubMed

Publication types

LinkOut - more resources