

Washing scaling of GeneChip microarray expression
- PMID: 20509934
- PMCID: PMC2901370
- DOI: 10.1186/1471-2105-11-291
Washing scaling of GeneChip microarray expression
Abstract
Background: Post-hybridization washing is an essential part of microarray experiments. Both the quality of the experimental washing protocol and adequate consideration of washing in intensity calibration ultimately affect the quality of the expression estimates extracted from the microarray intensities.
Results: We conducted experiments on GeneChip microarrays with altered protocols for washing, scanning and staining to study the probe-level intensity changes as a function of the number of washing cycles. For calibration and analysis of the intensity data we make use of the 'hook' method which allows intensity contributions due to non-specific and specific hybridization of perfect match (PM) and mismatch (MM) probes to be disentangled in a sequence specific manner. On average, washing according to the standard protocol removes about 90% of the non-specific background and about 30-50% and less than 10% of the specific targets from the MM and PM, respectively. Analysis of the washing kinetics shows that the signal-to-noise ratio doubles roughly every ten stringent washing cycles. Washing can be characterized by time-dependent rate constants which reflect the heterogeneous character of target binding to microarray probes. We propose an empirical washing function which estimates the survival of probe bound targets. It depends on the intensity contribution due to specific and non-specific hybridization per probe which can be estimated for each probe using existing methods. The washing function allows probe intensities to be calibrated for the effect of washing. On a relative scale, proper calibration for washing markedly increases expression measures, especially in the limit of small and large values.
Conclusions: Washing is among the factors which potentially distort expression measures. The proposed first-order correction method allows direct implementation in existing calibration algorithms for microarray data. We provide an experimental 'washing data set' which might be used by the community for developing amendments of the washing correction.
Figures


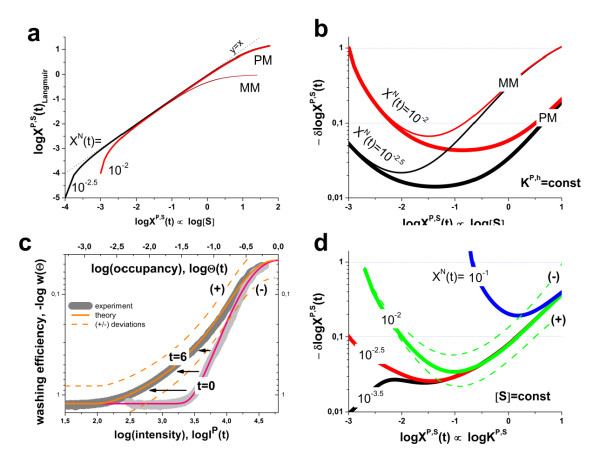
 . The graphs were calculated assuming KP,h = const for two non-specific background levels (red and black curves) and for PM and MM probes (dotted and solid curves) assuming the survival fractions wPM,S(t) = 0.95, wMM,S(t) = 0.50 and wP,N(t) = 0.1. Neglecting washing underestimates the expression degree especially at small and large expression values. Part c: The survival fraction of bound probes depends on the intensity (or, equivalently, probe occupancy) before (t = 0) and after washing (t > 0). The graph for t = 0 was re-plotted from Figure 5a using Eq. (17) with wmax = 0.9, wmin = 0.06, γ = 1.6 and a' = 0.1. The graph for t = 6 refers to the standard number of washing cycles. It is obtained from the t = 0 graph by making the substitution logI(t) = logI(0)+log(w(t)) in the argument (see Eq. (8)). Part d shows the bias of the Langmuir approximation assuming a constant transcript concentration and variable KP,S and thus a variable survival fraction w(Θ) which has been taken from part c of the figure for t = 6. The dashed curves labelled with '(+)' and '(-)' in panels c and d refer to 50%-deviations of the washing function, log w(Θ)+/- = log w(Θ)·(1.5)(+/-)1, to estimate the effect of the scattering of the probe level data from the mean (compare with Figure 5a). The bias of the Langmuir-approximation strongly resembles that shown in part b. Note that the bias applies to PM and MM probes as well in this case.

References
Publication types
MeSH terms
LinkOut - more resources
Full Text Sources
Molecular Biology Databases
