. 2010 May 28:11:342.
doi: 10.1186/1471-2164-11-342.

Bioinformatic identification and characterization of human endothelial cell-restricted genes

Affiliations

Bioinformatic identification and characterization of human endothelial cell-restricted genes

Manoj Bhasin et al. BMC Genomics. .

Abstract

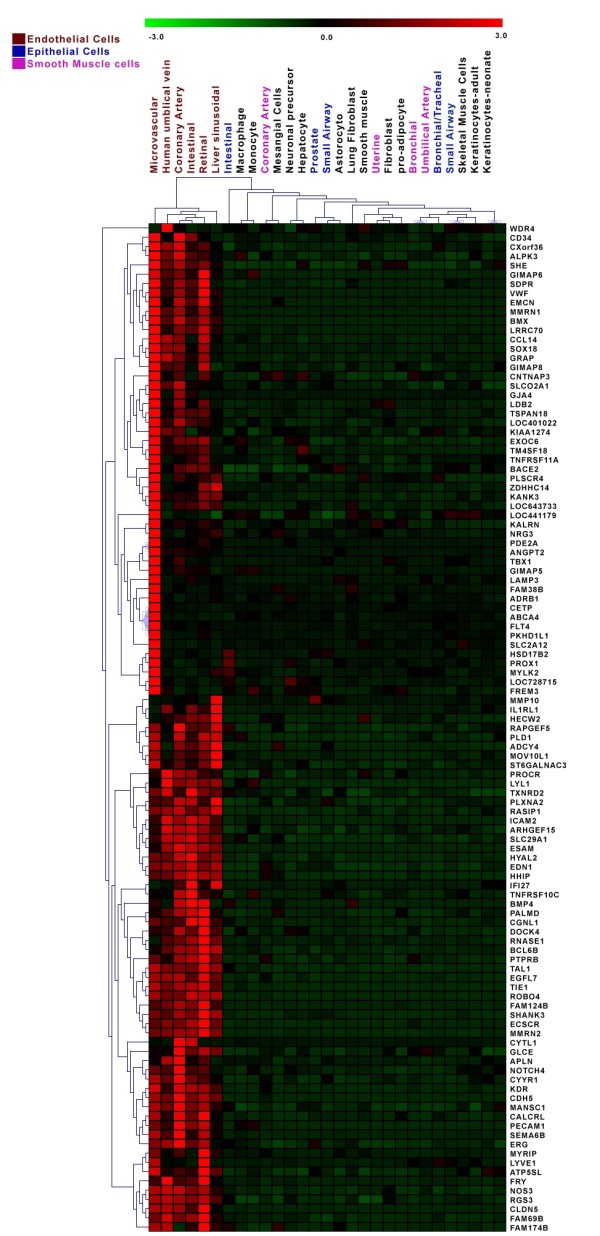
Background: In this study, we used a systematic bioinformatics analysis approach to elucidate genes that exhibit an endothelial cell (EC) restricted expression pattern, and began to define their regulation, tissue distribution, and potential biological role.

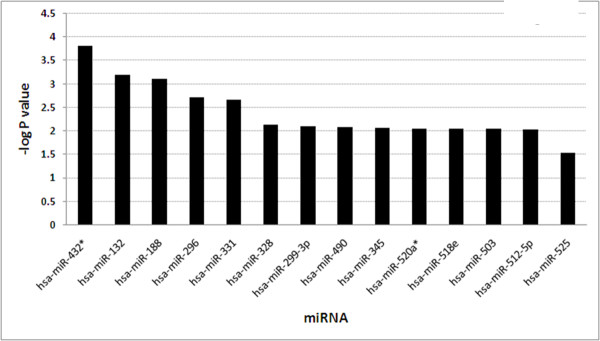
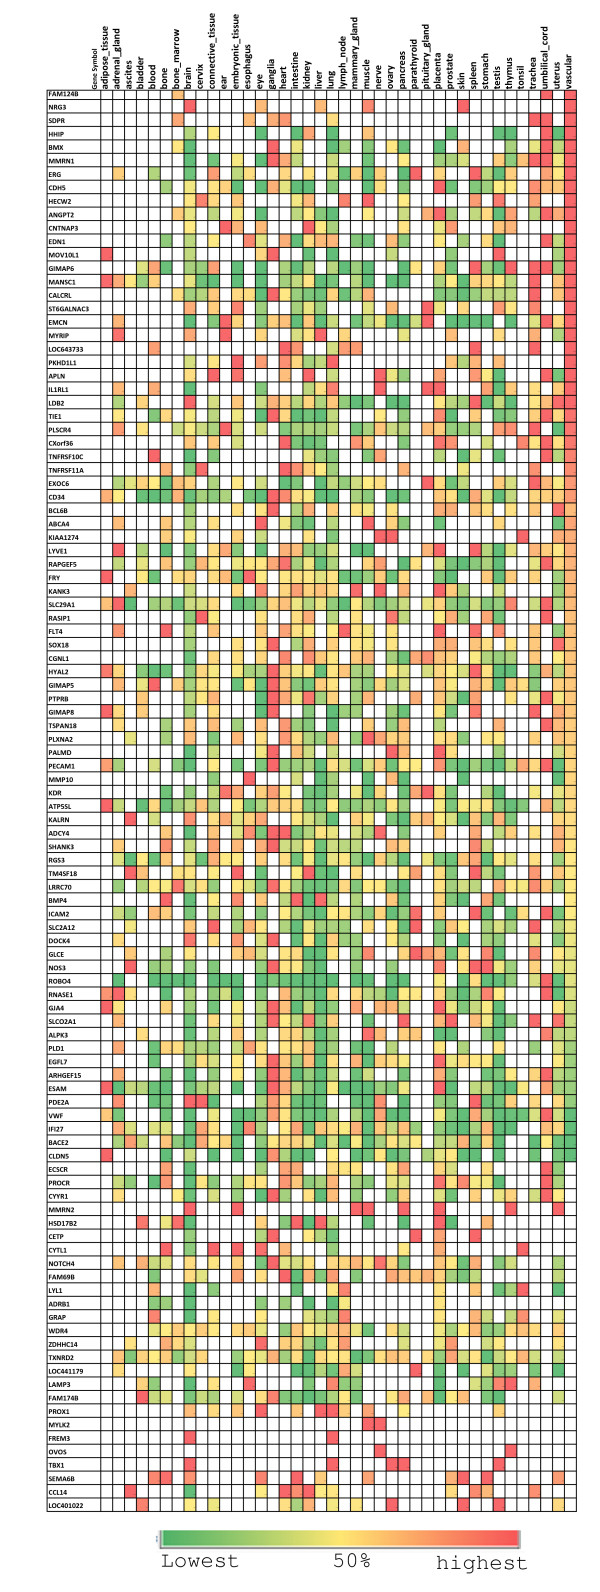
Results: Using a high throughput microarray platform, a primary set of 1,191 transcripts that are enriched in different primary ECs compared to non-ECs was identified (LCB >3, FDR <2%). Further refinement of this initial subset of transcripts, using published data, yielded 152 transcripts (representing 109 genes) with different degrees of EC-specificity. Several interesting patterns emerged among these genes: some were expressed in all ECs and several were restricted to microvascular ECs. Pathway analysis and gene ontology demonstrated that several of the identified genes are known to be involved in vasculature development, angiogenesis, and endothelial function (P < 0.01). These genes are enriched in cardiovascular diseases, hemorrhage and ischemia gene sets (P < 0.001). Most of the identified genes are ubiquitously expressed in many different tissues. Analysis of the proximal promoter revealed the enrichment of conserved binding sites for 26 different transcription factors and analysis of the untranslated regions suggests that a subset of the EC-restricted genes are targets of 15 microRNAs. While many of the identified genes are known for their regulatory role in ECs, we have also identified several novel EC-restricted genes, the function of which have yet to be fully defined.

Conclusion: The study provides an initial catalogue of EC-restricted genes most of which are ubiquitously expressed in different endothelial cells.


Figures

Figure 1
Figure 1
Overall approach for extraction of endothelial restricted genes. A) Unsupervised Pearson Correlation based cluster of different EC and non-EC arrays after normalizing the data. ECs (HMVEC, HUVEC, HPVEC, HAEC, and HCEAC) form separate clusters from non-ECs (HSAMC, B Cells, T Cells). In most of cases biological replicates of each cell type have better correlation with each other than with other cell types. B) Venn diagram indicating overlap between microvascular, arterial and venous endothelial differentially expressed genes obtained from the primary analysis C) Schematic representation of the approach for identifying the genes with EC-restricted expression (EC-restricted) D) Venn diagram depicting the overlap between microvascular, arterial and venous endothelial restricted transcripts.
Figure 2
Figure 2
Colorgram depicting the expression of EC-restricted genes in different cell types in the primary set. The columns represent the samples and rows represent the genes. Gene expression is shown with a pseudocolor scale (-3 to 3) with red color denoting high expression level and green color denoting low expression level of the gene. The scatter plots along the heatmap depict the different patterns in expression of EC-restricted genes obtained using K mean clustering. The K mean clusters are represented as scatter plots with bars denoting the mean expression level. Pattern I and IV depict a range of expression patterns exhibited by EC-restricted genes. For example pattern IV and I denotes the genes that are highly expressed in all endothelial cell types (pan EC) and HMVEC cells respectively.
Figure 3
Figure 3
Expression of ECs restricted genes in REFEXA database. A) Hierarchical clustering analysis of EC-restricted expression genes using REFEXA gene expression data. The columns represent the samples (primary endothelial and non endothelial cells from REFEXA database) and rows represent the genes. The detailed information about the primary cells can be obtained from REFEXA database http://157.82.78.238/refexa/main_search.jsp. Gene expression is shown with pseudocolor scale (-3 to 3) with red denoting high expression level and green denoting low expression level of gene.
Figure 4
Figure 4
Validation of a selected subset of endothelial-restricted genes by quantitative RT-PCR. Validation of a subset of EC-restricted genes from Table 1 was conducted using primary ECs and non-ECs by quantitative RT-PCR (n = 3 per cell type). The gene symbol is listed for each gene. RQ refers to "relative quantity" where the expression in HUVECs has been set to 1.0 and the relative expression of the other cell types are compared to that in HUVECs.
Figure 5
Figure 5
Enrichment analysis of EC-restricted genes. A) Top enriched Canonical Pathways B) Top enriched GO Processes. C) Top enriched disease set. The analysis for pathways and disease set enrichment was performed using the MetaCore tool of the GeneGo package. The GO categories enrichment analysis was performed using the DAVID tool. The Bar graphs depict the enriched pathway or Go process categories and -log of the P value. The P value depicts the significance of enrichment, the smaller is the P value the more significant is the enrichment. The pathways and disease sets with FDR adjusted P value < 0.05 are considered significant. The panel for gene ontology enrichment depicts the enrichments for each GO category (-log P value) as well as the Escore for a cluster of related GO categories.
Figure 6
Figure 6
Regulation analysis of EC-restricted genes. The list of the transcription factor binding sites that are enriched in 2 kb upstream to 100 bp downstream region. The enrichment in gene sets that are highly expressed in all endothelial cells and only microvascular EC is shown in black and grey color respectively. The X-axis represents the transcription factors and Y-axis represents -log P value.
Figure 7
Figure 7
Regulation analysis of EC-restricted genes in term of MiRNA targets. The list of the miRNA that are enriched in 3' UTR of EC specific genes. The X-axis represents the miRNA's and Y-axis represents -log P value. The miRNAs from the opposite standard of guided RNA strand are marked with star (*).
Figure 8
Figure 8
Relative normalized expression levels of EC-restricted genes in normal tissues. The expression level is expressed as relative percentage of expression in different tissues with red, yellow and green color denoting higher, median and lower expression levels respectively. The rows represent each gene and columns represent each normal tissue type.

References

    1. Cines DB, Pollak ES, Buck CA, Loscalzo J, Zimmerman GA, McEver RP, Pober JS, Wick TM, Konkle BA, Schwartz BS. et al.Endothelial cells in physiology and in the pathophysiology of vascular disorders. Blood. 1998;91(10):3527–3561. - PubMed
    1. Aird WC. Molecular heterogeneity of tumor endothelium. Cell Tissue Res. 2009;335:271–81. doi: 10.1007/s00441-008-0672-y. - DOI - PubMed
    1. Enomoto K, Nishikawa Y, Omori Y, Tokairin T, Yoshida M, Ohi N, Nishimura T, Yamamoto Y, Li Q. Cell biology and pathology of liver sinusoidal endothelial cells. Med Electron Microsc. 2004;37(4):208–215. doi: 10.1007/s00795-004-0261-4. - DOI - PubMed
    1. Choi YK, Kim KW. Blood-neural barrier: its diversity and coordinated cell-to-cell communication. BMB Rep. 2008;41(5):345–352. - PubMed
    1. Jones J, Otu H, Spentzos D, Kolia S, Inan M, Beecken WD, Fellbaum C, Gu X, Joseph M, Pantuck AJ. et al.Gene signatures of progression and metastasis in renal cell cancer. Clin Cancer Res. 2005;11(16):5730–5739. doi: 10.1158/1078-0432.CCR-04-2225. - DOI - PubMed

Publication types