

Bedside measurement of changes in lung impedance to monitor alveolar ventilation in dependent and non-dependent parts by electrical impedance tomography during a positive end-expiratory pressure trial in mechanically ventilated intensive care unit patients
- PMID: 20509966
- PMCID: PMC2911738
- DOI: 10.1186/cc9036
Bedside measurement of changes in lung impedance to monitor alveolar ventilation in dependent and non-dependent parts by electrical impedance tomography during a positive end-expiratory pressure trial in mechanically ventilated intensive care unit patients
Abstract
Introduction: As it becomes clear that mechanical ventilation can exaggerate lung injury, individual titration of ventilator settings is of special interest. Electrical impedance tomography (EIT) has been proposed as a bedside, regional monitoring tool to guide these settings. In the present study we evaluate the use of ventilation distribution change maps (DeltafEIT maps) in intensive care unit (ICU) patients with or without lung disorders during a standardized decremental positive end-expiratory pressure (PEEP) trial.
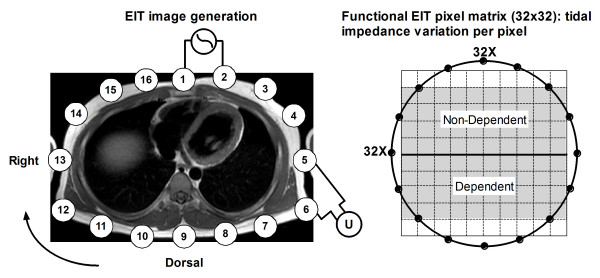
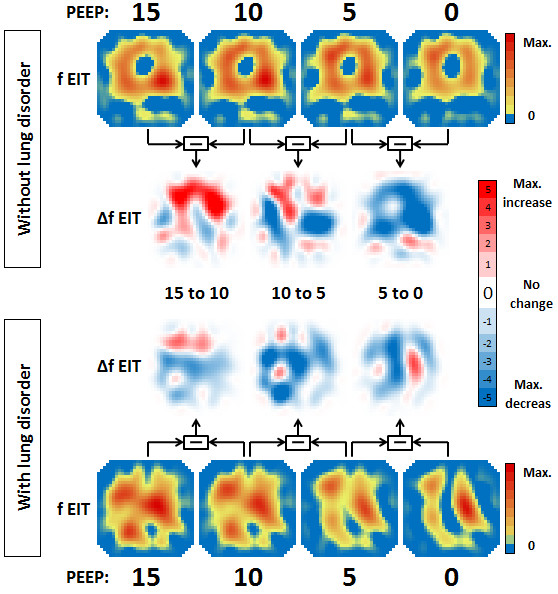
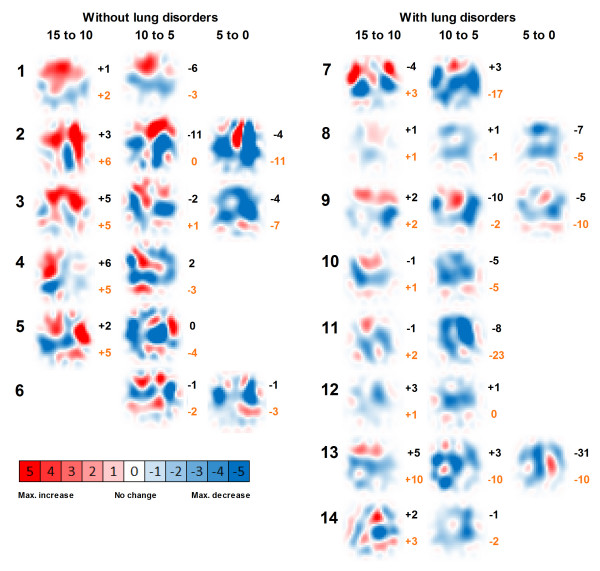
Methods: Functional EIT (fEIT) images and PaO2/FiO2 ratios were obtained at four PEEP levels (15 to 10 to 5 to 0 cm H2O) in 14 ICU patients with or without lung disorders. Patients were pressure-controlled ventilated with constant driving pressure. fEIT images made before each reduction in PEEP were subtracted from those recorded after each PEEP step to evaluate regional increase/decrease in tidal impedance in each EIT pixel (DeltafEIT maps).
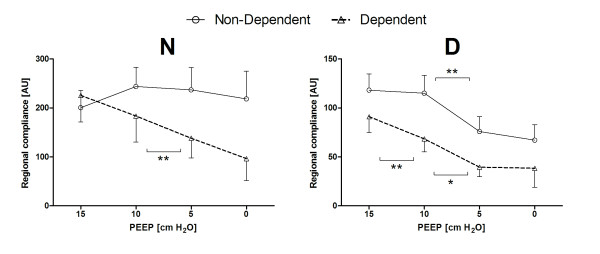
Results: The response of regional tidal impedance to PEEP showed a significant difference from 15 to 10 (P = 0.002) and from 10 to 5 (P = 0.001) between patients with and without lung disorders. Tidal impedance increased only in the non-dependent parts in patients without lung disorders after decreasing PEEP from 15 to 10 cm H2O, whereas it decreased at the other PEEP steps in both groups.
Conclusions: During a decremental PEEP trial in ICU patients, EIT measurements performed just above the diaphragm clearly visualize improvement and loss of ventilation in dependent and non-dependent parts, at the bedside in the individual patient.
Figures

Comment in
-
Safer ventilation of the injured lung: one step closer.Crit Care. 2010;14(4):192. doi: 10.1186/cc9028. Epub 2010 Aug 24. Crit Care. 2010. PMID: 20804577 Free PMC article.
Similar articles
-
Electrical impedance tomography measured at two thoracic levels can visualize the ventilation distribution changes at the bedside during a decremental positive end-expiratory lung pressure trial.Crit Care. 2011 Aug 11;15(4):R193. doi: 10.1186/cc10354. Crit Care. 2011. PMID: 21834953 Free PMC article.
-
Bedside Contribution of Electrical Impedance Tomography to Setting Positive End-Expiratory Pressure for Extracorporeal Membrane Oxygenation-treated Patients with Severe Acute Respiratory Distress Syndrome.Am J Respir Crit Care Med. 2017 Aug 15;196(4):447-457. doi: 10.1164/rccm.201605-1055OC. Am J Respir Crit Care Med. 2017. PMID: 28103448
-
Assessment of electrical impedance tomography to set optimal positive end-expiratory pressure for veno-venous ECMO-treated severe ARDS patients.J Crit Care. 2020 Dec;60:38-44. doi: 10.1016/j.jcrc.2020.06.017. Epub 2020 Jul 8. J Crit Care. 2020. PMID: 32736198
-
Electrical impedance tomography: A compass for the safe route to optimal PEEP.Respir Med. 2021 Oct;187:106555. doi: 10.1016/j.rmed.2021.106555. Epub 2021 Jul 30. Respir Med. 2021. PMID: 34352563 Review.
-
Lung monitoring at the bedside in mechanically ventilated patients.Curr Opin Crit Care. 2012 Jun;18(3):261-6. doi: 10.1097/MCC.0b013e3283534a4a. Curr Opin Crit Care. 2012. PMID: 22543298 Review.
Cited by
-
Speaking valves in tracheostomised ICU patients weaning off mechanical ventilation--do they facilitate lung recruitment?Crit Care. 2016 Apr 1;20:91. doi: 10.1186/s13054-016-1249-x. Crit Care. 2016. PMID: 27038617 Free PMC article.
-
Clinical Scenarios of the Application of Electrical Impedance Tomography in Paediatric Intensive Care.Sci Rep. 2019 Mar 29;9(1):5362. doi: 10.1038/s41598-019-41774-1. Sci Rep. 2019. PMID: 30926828 Free PMC article.
-
Use of thoracic electrical impedance tomography as an auxiliary tool for alveolar recruitment maneuvers in acute respiratory distress syndrome: case report and brief literature review.Rev Bras Ter Intensiva. 2015 Oct-Dec;27(4):406-11. doi: 10.5935/0103-507X.20150068. Rev Bras Ter Intensiva. 2015. PMID: 26761481 Free PMC article. Review.
-
Unmatched ventilation and perfusion measured by electrical impedance tomography predicts the outcome of ARDS.Crit Care. 2021 Jun 3;25(1):192. doi: 10.1186/s13054-021-03615-4. Crit Care. 2021. PMID: 34082795 Free PMC article.
-
A unified approach for EIT imaging of regional overdistension and atelectasis in acute lung injury.IEEE Trans Med Imaging. 2012 Mar;31(3):834-42. doi: 10.1109/TMI.2012.2183641. Epub 2012 Jan 10. IEEE Trans Med Imaging. 2012. PMID: 22249646 Free PMC article.
References
MeSH terms
LinkOut - more resources
Full Text Sources
Other Literature Sources
Medical
Research Materials
