. 2010 Jun;47(6):507-13.
doi: 10.1016/j.ceca.2010.04.004. Epub 2010 May 26.

Calcium clearance and its energy requirements in cerebellar neurons

Affiliations

Calcium clearance and its energy requirements in cerebellar neurons

Maxim V Ivannikov et al. Cell Calcium. 2010 Jun.

Abstract

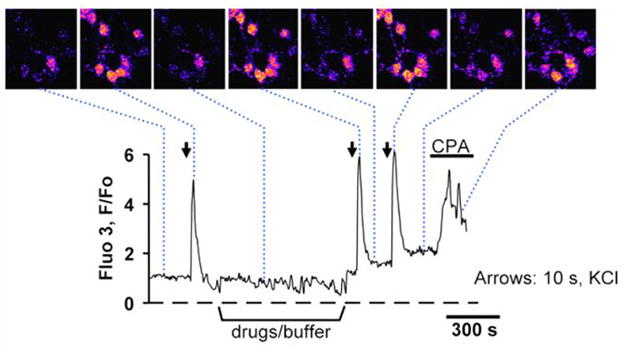
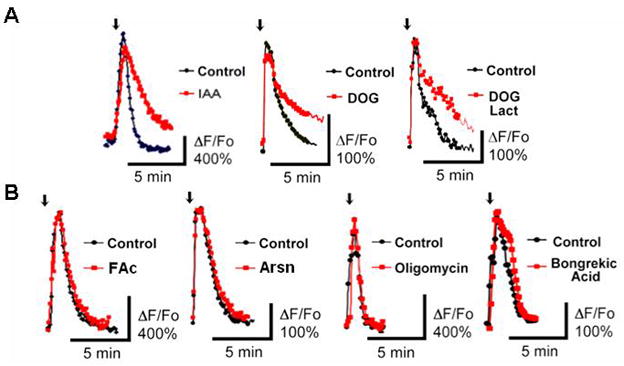
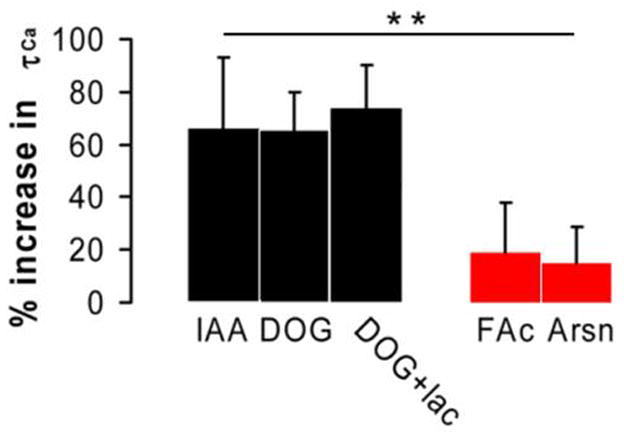
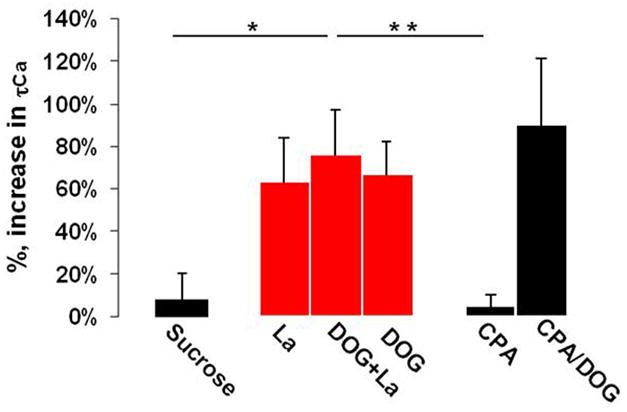
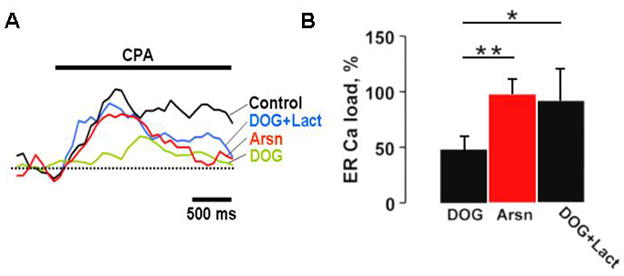
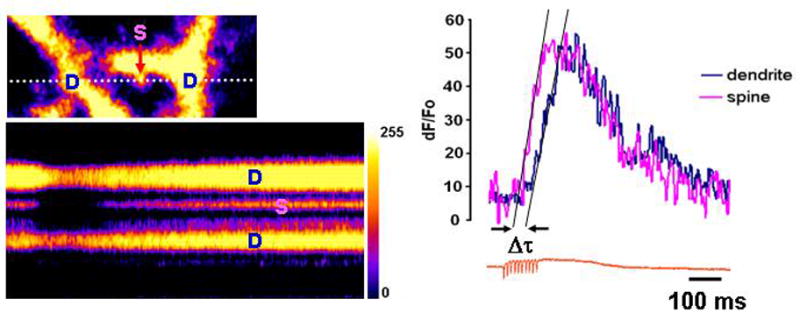
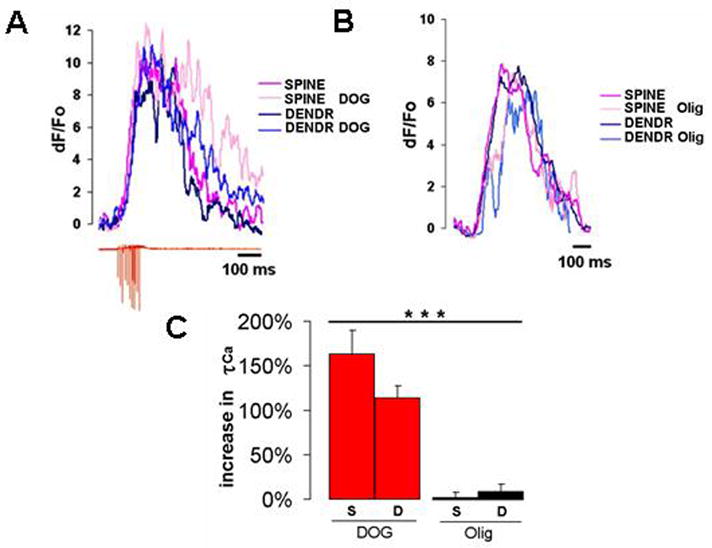
Quick cytosolic calcium clearance is essential for the effective modulation of various cellular functions. An excess of cytosolic calcium after influx is largely removed via ATP-dependent mechanisms located in the plasma membrane and the endoplasmic reticulum. Therefore, calcium clearance depends critically on the adequate supply of ATP, which may come from either glycolysis or mitochondria, or both. However, it presently remains unknown the degree to which individual ATP generating pathways - glycolysis and mitochondria power ATP-dependent calcium as well as other vital ion clearance mechanisms in neurons. In this study, we explored the relationship between the energy generating pathways and ion clearance mechanisms in neurons by characterizing the effects of glycolytic and mitochondrial inhibitors of ATP synthesis on calcium clearance kinetics in the soma, dendrites and spines. Stimulation of cultured cerebellar granule cells by brief pulses of 60mM potassium ACSF, and electrical stimulation of purkinje cells in acutely prepared slices led to a transient calcium influx, whose clearance was largely mediated by the plasma membrane Ca(2+)-ATPase pump. Inhibition of glycolysis by deoxyglucose or iodoacetic acid resulted in a marked slowing in calcium clearance in the soma, dendrites, and spines with the spines affected the most. However, inhibition of the mitochondrial citric acid cycle with fluoroacetate and arsenite, or mitochondrial ATP synthase with oligomycin did not produce any immediate effects on calcium clearance kinetics in any of those neuronal regions. Although cytosolic calcium clearance was not affected by the inhibition of mitochondria, the magnitude of the calcium clearance delay induced by glycolytic inhibitors in different neuronal compartments was related to their mitochondrial density. Conversely, the endoplasmic reticulum Ca(2+)-ATPase pump activity is fuelled by both glycolytic and mitochondrial ATP, as evidenced by a minimal change in the endoplasmic reticulum calcium contents in cells treated with either deoxyglucose supplemented with lactate or arsenite. Taken together, these data suggest that calcium clearance in cerebellar granule and purkinje cells relies on the plasma membrane Ca(2+)-ATPase, and is powered by glycolysis.


Figures

Figure 1
Figure 1. Calcium transients in cultured cerebellar granule cells
Fluorescent images of cultured cerebellar granule cells (the top row) loaded with 1 μM fluo-3AM and stimulated by brief pulses of 60 mM K+ ACSF (arrows) solution produced reproducible calcium responses. Addition of 50 μM CPA (horizontal bar) led to the release of ER calcium as evidenced by a transient increase in [Ca2+]i.
Figure 2
Figure 2. Inhibition of glycolysis slows down cytosolic calcium clearance in the soma of cultured cerebellar granule cells
A) Pretreatment of cultured cerebellar granule cells with glycolytic inhibitors - 1 mM IAA, 10 mM DOG, or 10 mM DOG with 5 mM lactate for 5 min delayed clearance of KCl-evoked [Ca2+]i transients as shown by red traces. B) Arsn or abolition of mitochondrial ATP production with 5 μg/ml oligomycin and 5 μM bongrekic acid (shown in red) did not have an immediate influence on [Ca2+]i clearance. Arrows in A and B: 10 s, 60 mM K+ ACSF.
Figure 3
Figure 3. Inhibition of glycolysis but not mitochondria prolongs calcium clearance
Statistical analysis of mitochondrial and glycolytic inhibitors effects on [Ca2+]i clearance in cultured cerebellar granule neurons. Plotted are the mean values of the half-clearance times for various metabolic inhibitors with their corresponding confidence intervals derived from t-test with p<0.05 (n=8 for all except DOG+lac, n=5 (fields of view)). ANOVA single factor analysis with Bonferroni correction was used to cross compare individual means of glycolytic and mitochondrial inhibitors (** P<0.01).
Figure 4
Figure 4. Plasma membrane Ca2+ ATP-dependent pump is powered by glycolysis
Shown are the mean values of the percentage increase in calcium τ1/2 over control for each treatment and their corresponding confidence intervals derived from t-test with p<0.05, and n=7 (fields of view). Cultured cerebellar granule cells were treated with the specific inhibitors of calcium clearance mechanisms: 224 mM sucrose ACSF to inhibit NCX, 300 μM La3+ used for PMCA, 50 μM CPA for SERCA. Disruption of the plasma membrane Ca2+ pump activity in cerebellar granule cells resulted in the largest delay in [Ca2+]i clearance, and it was similar to the delay seen with 10 mM DOG. ANOVA single factor analysis with Bonferroni correction was used to cross compare individual means for each inhibitor (* P<0.05, ** P<0.01).
Figure 5
Figure 5. ER Ca2+ ATP-dependent pump derives its ATP from both glycolysis and mitochondria
A) ER calcium load in cerebellar granule cells was assessed by measuring the area under the peak of [Ca2+]i induced by 50 μM CPA. Pretreatment with 10 mM DOG for 5 min led to a substantial reduction in ER calcium which was reversed by the addition of 5 mM lactate. Inhibition of mitochondrial citric acid cycle with 1 mM Arsn produced a negligible effect. B) Statistical analysis of the effects of metabolic inhibitors on ER calcium contents. Shown are the mean area values for each treatment expressed as a percentage of control (no drugs) and their corresponding confidence intervals derived from t-test with p<0.05, and n=6 (cells). ANOVA single factor analysis with Bonferroni correction was used to cross compare individual means for each inhibitor (* P<0.05, ** P<0.01).
Figure 6
Figure 6. Imaging of dendritic and spine calcium kinetics
Shown on the right is the image of a portion of Purkinje cell dendritic tree, with the white dotted line indicating the line scan location and crossing 2 dendrites (D) and the spine (S). The results of the line scan with pulse-train stimulation are presented below. The dendritic and spine calcium responses are plotted in the graph and show that the onset of calcium influx in the spine precedes that one in the dendrite by ~ 30 ms.
Figure 7
Figure 7. Glycolysis is essential for calcium clearance in both the dendrites and the spines
A) Amplitude-adjusted calcium responses in the dendrite and the spine before and after treatment with 10 mM DOG with 5 mM lactate. Inhibition of glycolysis slows calcium clearance in both compartments, with the spine exhibiting the strongest effect. B) Disruption of mitochondrial ATP synthase with 5 μg/ml oligomycin does not alter calcium response in either the dendrites or the spine. C) Statistical analysis of the effects of glycolytic and mitochondrial inhibitors on calcium kinetics in the dendrites and the spines. the mean values of the percentage increase in calcium τ1/2 over control for each treatment and their corresponding confidence intervals derived from t-test with p<0.05, and n=5 (cells). ANOVA single factor analysis with Bonferroni correction was used to cross compare individual means for every inhibitor (*** P<0.001).

References

    1. Erecinska M, Dagani F. Relationships between the neuronal sodium/potassium pump and energy metabolism. Effects of K+, Na+, and adenosine triphosphate in isolated brain synaptosomes. J Gen Physiol. 1990;95:591–616. - PMC - PubMed
    1. Matsumura F, Clark JM. ATP-utilizing systems in the squid axons: a review on the biochemical aspects of ion-transport. Prog Neurobiol. 1982;18:231–55. - PubMed
    1. Atwell D, Laughlin SB. An energy budget for signaling in the grey matter of the brain. J Cereb Blood Flow Metab. 2001;21:1133–1145. - PubMed
    1. Lenny P. The cost of cortical computation. Curr Biol. 2003;13:493–7. - PubMed
    1. Bano D, Young KW, Guerin CJ, Lefeuvre R, Rothwell NJ, Naldini L, Rizzuto R, Carafoli E, Nicotera P. Cleavage of the plasma membrane Na+/Ca2+ exchanger in excitotoxicity. Cell. 2005;120:275–285. - PubMed

Publication types

MeSH terms