Review
. 2010 May 27;66(4):477-91.
doi: 10.1016/j.neuron.2010.03.027.

Visual guidance of smooth-pursuit eye movements: sensation, action, and what happens in between

Affiliations
Review

Visual guidance of smooth-pursuit eye movements: sensation, action, and what happens in between

Stephen G Lisberger. Neuron. .

Abstract

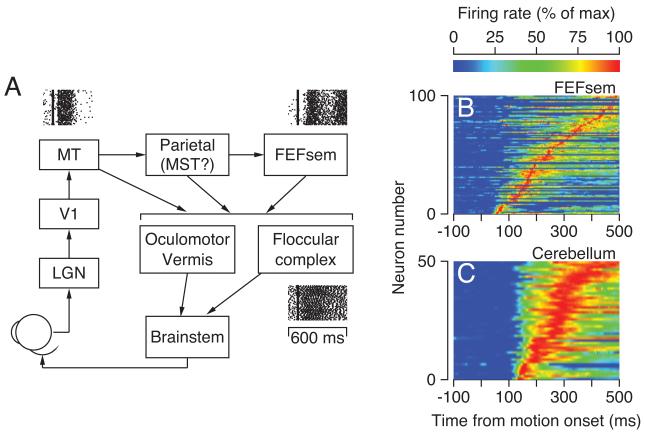
Smooth-pursuit eye movements transform 100 ms of visual motion into a rapid initiation of smooth eye movement followed by sustained accurate tracking. Both the mean and variation of the visually driven pursuit response can be accounted for by the combination of the mean tuning curves and the correlated noise within the sensory representation of visual motion in extrastriate visual area MT. Sensory-motor and motor circuits have both housekeeping and modulatory functions, implemented in the cerebellum and the smooth eye movement region of the frontal eye fields. The representation of pursuit is quite different in these two regions of the brain, but both regions seem to control pursuit directly with little or no noise added downstream. Finally, pursuit exhibits a number of voluntary characteristics that happen on short timescales. These features make pursuit an excellent exemplar for understanding the general properties of sensory-motor processing in the brain.


Figures

Figure 1
Figure 1
Pursuit of step-ramp target motion. From top to bottom the traces are superimposed eye and target position and superimposed eye and target velocity. Dashed and continuous traces show target and eye motion. The diagonal arrow points out a saccadic change in eye position, causing the rapid and large downward deflection in the eye velocity trace. The shaded area on the velocity traces indicates target motion with respect to the eye, namely the image motion that provides the stimulus for the visual motion system that drives pursuit eye movement. Data are a modern example of the original experiments by Rashbass (1961).
Figure 2
Figure 2
Simple model population response in MT. The circles at the top represent 7 model MT neurons that are tuned for target speed, and the number above each circle indicates the neuron’s preferred speed. From top to bottom, the three lines of neural responses indicate the spikes in model neurons for motion of a bright target at 6 deg/s, motion of a bright target at 10 deg/s, and motion of a dim target at 10 deg/s. Numbers at the right indicate the estimates of target speed obtained by three different decoding computations.
Figure 3
Figure 3
Pursuit estimates target speed by computing the center-of-mass, or vector-average, of the population response in extrastriate visual area MT. A: Schematic diagrams representing the speed tuning curves of 5 selected MT neurons during smooth target motion (blue) and target motion that has been degraded by flashing the target at sequential locations (red). Symbols indicate the responses of the 5 neurons to target motion at 20 deg/s. B: MT population responses synthesized by plotting the responses of the 5 MT neurons in A as a function of their preferred speeds and fitting smooth curves. Arrows indicate the center-of-mass or vector-average of the two population responses. C: Average eye velocity as a function of time during step-ramp pursuit from a monkey. Red and black traces show responses to smooth and degraded target motion. D: Estimates of target speed as a function of the interval between flashes in the degraded, sampled target motion. Black symbols show measurements made from the pursuit of a monkey and red symbols show predictions made by using vector-averaging to decode a model population response based on recordings from area MT. Data are replotted from Churchland and Lisberger (2001).
Figure 4
Figure 4
Comparison of trial-by-trial variation in pursuit and vestibulo-ocular reflex. Schematic diagram summarizes possible sources of variation in estimates of target speed and direction for pursuit eye movements and motion perception. A, B: Mean and variance of eye velocity for pursuit of target motion at 20 deg/s (A) and for the vestibulo-ocular reflex evoked by head motion to the left at 20 deg/s. Black curves show the mean eye velocity and the gray shaded areas indicate the trial-by-trial variance of eye velocity.
Figure 5
Figure 5
Trial-by-trial variation in pursuit explained in terms of correlated noise across the population response in sensory area MT. A: Model population responses obtained by presenting a target motion at one speed and predicting the response of many neurons as a function of their preferred speed. Red curve shows the average across many repetitions of the same stimulus and black curves show population responses for individual target motions. B: Neuron-neuron spike count correlations for pairs of MT neurons as a function of the difference in the preferred speed of the two neurons in the pair. Each symbol shows data from an individual pair of neurons and the red and black symbols show pairs with statistically significant versus non-significant correlations. C: Variance of estimates of target speed obtained by using vector averaging to decode model population responses under different assumptions about the magnitude and structure of neuron-neuron spike count correlations. Data have been simplified and replotted from Huang and Lisberger (2009).
Figure 6
Figure 6
Responses of neural populations at different levels in the pursuit circuit. A: Schematic diagram of the pursuit circuit. Rasters are taken from representative neurons recorded in MT, the FEFSEM, and the floccular complex during step-ramp target motion. Each raster was constructed from responses to many repetitions of the same target motion, and each line of the raster shows the response to one motion. B, C: Color maps showing the time course of average firing rate for each individual neuron studied in the FEFSEM (C) and the floccular complex (D). Each horizontal line of the color map shows the time course for a different neuron, and the color scale shows the value of firing rate, normalized to the peak for that neuron. Neurons in B and C were reported in Schoppik et al. (2008) and Medina and Lisberger (2007).
Figure 7
Figure 7
Variation, signal, and noise in the pursuit circuit. A: Correlation between eye velocity and instantaneous firing rate during the initiation of pursuit in one floccular Purkinje cell. Each symbol shows data from a different behavioral trial. “Eye velocity” is in quotes because the actual eye movement has been transformed into units of firing rate (see Lisberger and Medina, 2007). B: Neuron-pursuit correlation as a function of time, averaged across all floccular Purkinje cells. Vertical dashed line shows the peak neuron-pursuit correlation during the initiation of pursuit. C, D: Color maps showing the time course of neuron-pursuit correlations for each individual neuron studied in the FEFSEM (C) and the floccular complex (D). The color scale shows the value of the neuron-pursuit correlation coefficient and each line shows the time course for a different neuron. E: Variation predicted to be added to pursuit commands downstream from the floccular complex as a function of time. Curves with different rendering show predictions for different target speeds. F: Results of a simple population model showing the relationship between variation added downstream, the size of the population, and neuron-pursuit correlations. The color scale plots the predicted product of neuron-pursuit correlations in pairs of neurons recorded simultaneously. Data are replotted from Medina and Lisberger (2007) and Schoppik et al. (2008).
Figure 8
Figure 8
A gain, or volume, control that modulates visual-motor transmission for pursuit. The schematic diagram indicates the pursuit activation, motor attention, saccades, and the output from the FEFSEM are capable of adjusting the gain of visual-motor transmission. A: Target motion used to demonstrate gain control. From top to bottom the traces are superimposed eye and target position and superimposed eye and target velocity. Red and black show eye and target motion. The black arrow points to the perturbation of target velocity and the red arrow points to the eye velocity response, 100 ms later. The perturbation of target velocity caused a transient deflection of target position that was too small to see on the low resolution records in this panel. B: Black and purple traces show the time course of the eye velocity evoked by the same perturbation of a moving target that was evoking pursuit or of a stationary target that was used to maintain fixation. C: Eye velocity evoked by a 75 ms electrical micro-stimulation in the FEFSEM. Black and red traces show responses to the same simulation during fixation versus during steady-state pursuit. D: Eye velocity evoked by a brief perturbation of a stationary target that the monkey is fixating. Black and magenta traces show the responses in the presence and absence of concurrent electrical micro-stimulation in the FEFSEM. Data in A and B are replotted from Schwartz and Lisberger (1994). Data in C and D are replotted from Tanaka and Lisberger (2001).
Figure 9
Figure 9
Gain control controlled by saccade execution as a mechanism of target choice for pursuit. In each diagram, the black arrows indicate the orthogonal motion of two potential tracking targets. The red circles indicate the initial position of fixation. The blue arrows indicate pre-saccadic pursuit in a direction that represents the vector average of the two target motions. The red dots indicate saccades to T1 in A and T2 in B. The red arrows show post-saccadic pursuit in the direction of the chosen target, even in the time immediately after the end of the saccade, indicated by the ellipses.
Figure 10
Figure 10
Multiple functions for efference copy in the pursuit circuit. The arrows show the flow of neural signals. The open circles are summing junctions and the circle with an X in it is a multiplication junction that implements gain control. Blue and red arrows show the flow of efference copy signals through the floccular complex of the cerebellum. Blue and magenta arrows show the flow of efference copy signals through the FEFSEM.

Similar articles

Cited by

References

    1. Allman JH, Kaas JH, Lane RH. The middle temporal visual area (MT) in the bushbaby, Galago senegalensis. Brain Res. 1973;57:197–202. 1973. - PubMed
    1. Arshavsky YI, Gelfand IM, Orlovsky GN, Pavlova GA. Messages conveyed by spinocerebellar pathways during scratching in the cat. II. Activity of neurons in the ventral spinocerebellar tract. Brain Res. 1978;151:493–506. - PubMed
    1. Bair W, Zohary E, Newsome WT. Correlated firing in macaque visual area MT: time scales and relationship to behavior. J Neurosci. 2001;21:1676–1697. - PMC - PubMed
    1. Basso MA, Pokorny JJ, Liu P. Activity of substantia nigra pars reticulata neurons during smooth pursuit eye movements in monkeys. Eur. J. Neurosci. 2005;22:448–464. - PubMed
    1. Beck JM, Ma WJ, Kiani R, Hanks T, Churchland AK, Roitman J, Shadlen MN, Lathan PE, Pouget A. Probabilistic population codes for Bayesian decision making. Neuron. 2008;60:1142–1152. - PMC - PubMed

Publication types

LinkOut - more resources