. 2010 Jul 30:1346:92-101.
doi: 10.1016/j.brainres.2010.05.057. Epub 2010 May 26.

Distribution of 5-HT1B and 5-HT1D receptors in the inner ear

Affiliations

Distribution of 5-HT1B and 5-HT1D receptors in the inner ear

Seong-Ki Ahn et al. Brain Res. .

Abstract

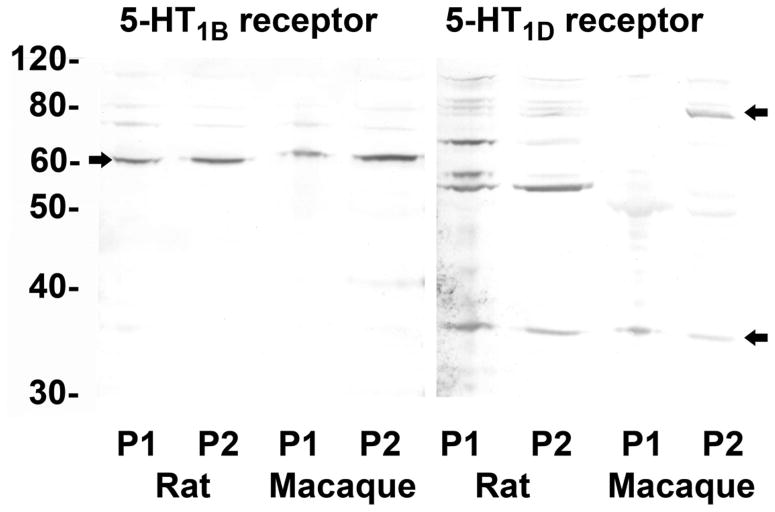
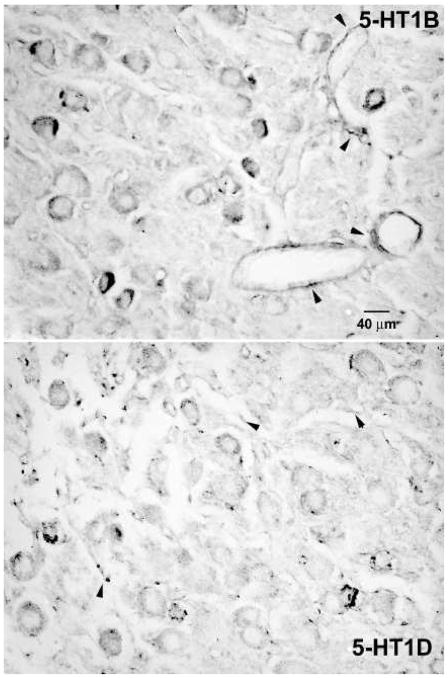
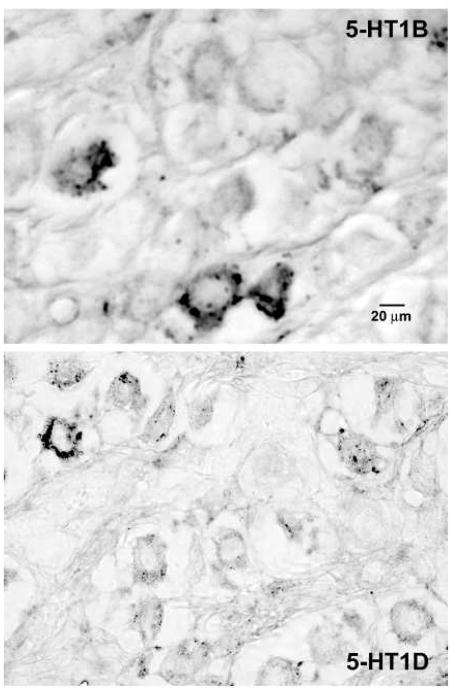
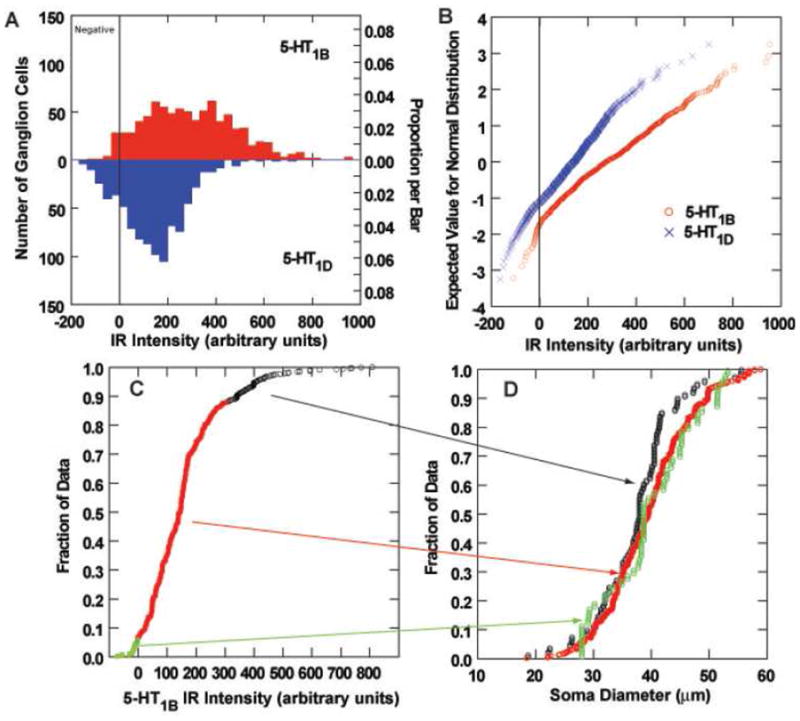
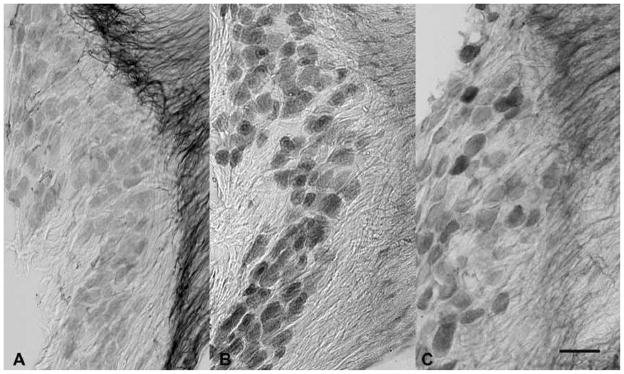
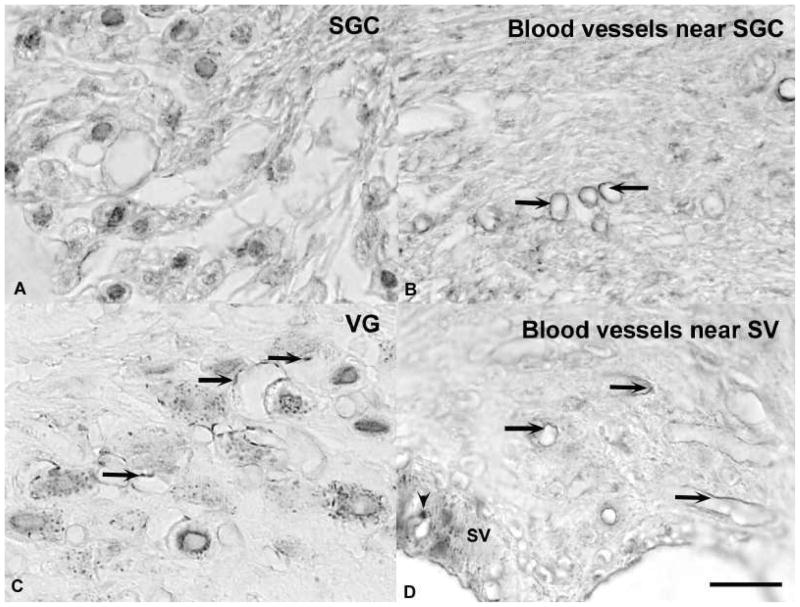
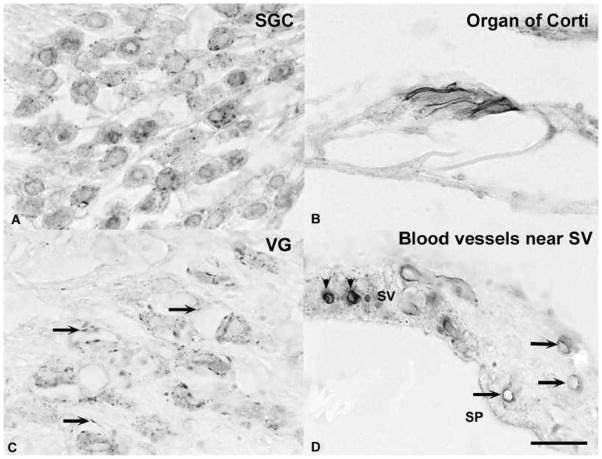
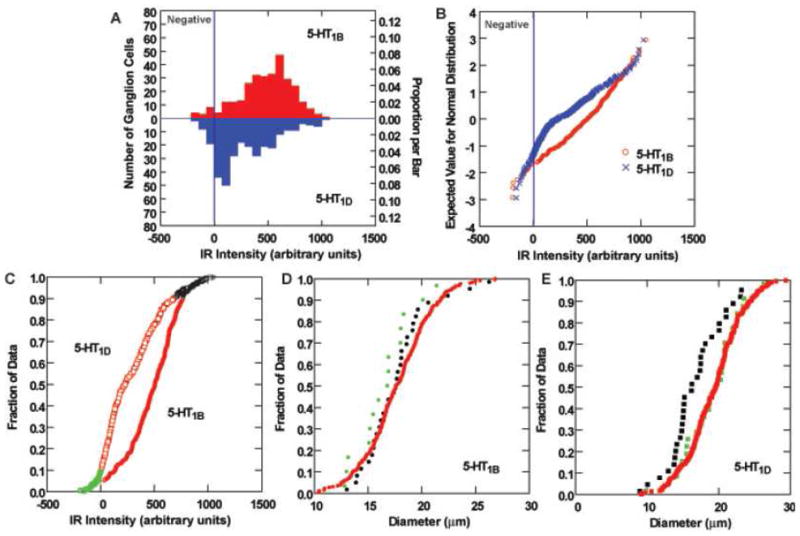
Migraine and anxiety disorders are frequently co-morbid with balance disorders. This study examined the relative distribution of subtypes of serotonin (5-HT) receptor in the inner ear of monkeys and rats. Most vestibular ganglion cells were immunoreactive for 5-HT(1B) and 5-HT(1D) receptors in macaques and rats. In the inner ear, 5-HT(1B) and 5-HT(1D) receptor immunopositivity was associated with endothelial cells of the vestibular ganglion, spiral ganglion, vestibulocochlear nerve, spiral ligament and stria vascularis. It was noteworthy that 5-HT(1B) and 5-HT(1D) receptors are expressed in parallel sites in peripheral vestibular and trigeminal systems, which may be a factor underlying the efficacy of triptans in treating migraine and migrainous vertigo. Because the vestibular ganglion and trigeminal ganglion are both within the subarachnoid space, an interaction between 5-HT(1B) and TRPV1 receptors on blood vessel and ganglion cells may also contribute to the vasospasm and the comorbid headache, dizziness, nausea and vomiting that accompany subarachnoid hemorrhage.


Figures

Figure 1
Figure 1
Western blots. Proteins from P1 and P2 fractions of rat brain and monkey medulla oblongata were separated on a NuPAGE 10% Bis-Tris gel and blotted onto an Invitrolon PVDF membrane (Invitrogen). Binding of the primary antibody (1:1000 dilution) was detected with an alkaline phospatase-conjugated secondary antibody and histochemical substrate (WesternBreeze, Invitrogen). The blot was digitized with a flatbed photo scanner (Epson V500). Arrows indicate major immunopositive bands in rats and monkeys mentioned in text.
Figure 2
Figure 2
Photomicrographs of the vestibular ganglion from decalcified, paraffin embedded monkey temporal bones. Vestibular ganglion cells showed expression of 5-HT1B (upper panel) and 5-HT1D (lower panel) immunoreactivity. Perivascular staining is indicated by small arrowheads.
Figure 3
Figure 3
Photomicrographs of spiral ganglion cells from decalcified, paraffin embedded monkey temporal bones. Representative images of 5-HT1B (upper panel) and 5-HT1D (lower panel) immunoreactivity illustrate that there were fewer intensely immunoreactive ganglion cells in the spiral ganglion than the vestibular ganglion, interspersed among many very lightly stained and immunonegative neurons.
Figure 4
Figure 4
Analysis of 5-HT1B and 5-HT1D immunoreactivity (IR) of monkey vestibular ganglion cells. A. Histograms of the distribution of 5-HT1B (upper panel) and 5-HT1D (lower panel) IR of vestibular ganglion cells. The demarcation between immunonegative and immunopositive data is shown by a vertical line. B. Full normal probability plots of the intensity data from panel A. The demarcation between immunonegative and immunopositive data is shown by a vertical line. C. The cumulative distribution curve for the intensity of 5-HT1B IR, with immunonegative cells plotted in green symbols, immunopositive cells below the 90th percentile in intensity shown in red symbols, and the most intensely immunopositive cells (most intense 10%) plotted in black symbols. D. Cumulative distribution functions of soma sizes are shown for the three intensity populations identified in panel C. Note that the most intensely stained neurons tend to be smaller than less intensely IR or immunonegative vestibular ganglion cells.
Figure 5
Figure 5
Photomicrographs of the vestibular ganglion from frozen sections of ganglia extracted with the brain. Vestibular ganglion cells showed reasonably intense expression of 5-HT1A (photo A), 5-HT1B (photo B) and 5-HT1D (photo C) receptor immunoreactivity. Immunoreactive fibers extended into the central portion of the vestibular nerve. The calibration bar represents 50 μm.
Figure 6
Figure 6
Photomicrographs of 5-HT1B immunoreactivity in paraffin embedded, decalcified temporal bone sections. A. Spiral ganglion cells (SGC) showed punctuate immunoreactivity associated with the somatic cell membrane. B. Arrows show examples of both punctuate and linear immunopositivity that was associated with small blood vessels near the SGCs. C. Vestibular ganglion (VG) cells displayed punctuate somatic immunoreactivity. Arrows indicate immunoreactivity that was associated with blood vessels. D. Arrows show examples of both punctuate and linear immunopositivity that was associated with small blood vessels near the stria vascularis (SV). The plain arrowhead indicates a process of a melanocyte. The calibration bar represents 20 μm.
Figure 7
Figure 7
Photomicrographs of 5-HT1D immunoreactivity in paraffin embedded decalcified temporal bone sections. A. Spiral ganglion cells (SGC) showed punctuate immunoreactivity associated with the somatic cell membrane. B. An intense immunoreaction was associated with the margin of outer hair cells in the organ of Corti.. C. Vestibular ganglion (VG) cells displayed punctuate somatic immunoreactivity. Arrows indicate immunoreactivity that was associated with blood vessels. D. Arrows show examples of both punctuate and linear immunopositivity that was associated with small blood vessels near the stria vascularis (SV). The plain arrowheads indicate SV melanocytes. The calibration bar represents 20 μm.
Figure 8
Figure 8
Analysis of 5-HT1B and 5-HT1D immunoreactivity (IR) of rat vestibular ganglion cells. A. Histograms of the distribution of 5-HT1B (upper panel) and 5-HT1D (lower panel) IR of vestibular ganglion cells. The demarcation between immunonegative and immunopositive data is shown by a vertical line. B. Full normal probability plots of the intensity data from panel A. The demarcation between immunonegative and immunopositive data is shown by a vertical line. C. The cumulative distribution curve for the intensity of 5-HT1B IR, with immunonegative cells plotted in green symbols, immunopositive cells below the 90th percentile in intensity shown in red symbols, and the most intensely immunopositive cells (most intense 10%) plotted in black symbols. D–E. Cumulative distribution functions of soma sizes are shown for the three intensity populations identified in panel C. There is association between intense 5-HT1B immunoreactivity and soma diameter (D). However, the most intensely 5-HT1D stained neurons (F) are smaller than less intensely IR or immunonegative vestibular ganglion cells.

References

    1. Ansar S, Svendgaard NA, Edvinsson L. Neurokinin-1 receptor antagonism in a rat model of subarachnoid hemorrhage: prevention of upregulation of contractile ETB and 5-HT1B receptors and cerebral blood flow reduction. J Neurosurg. 2007;106:881–886. - PubMed
    1. Balaban CD, Zhou J, Li HS. Type 1 vanilloid receptor expression by mammalian inner ear ganglion cells. Hearing Research. 2003;175:165–170. - PubMed
    1. Barnes NM, Sharp T. A review of central 5-HT receptors and their function. Neurophamacology. 1999;38:1083–1052. - PubMed
    1. Cambj-Sapunar L, Yu M, Harder DR, Roman RJ. Contribution of 5-hydroxytryptamine1B receptors and 20-hydroxyeiscosatraenoic acid to fall in cerebral blood flow after subarachnoid hemorrhage. Stroke. 2003;34:1264–1275. - PubMed
    1. Dieterich M, Krafczyk S, Querner V, Brandt T. Somatoform phobic postural vertigo and psychogenic disorders of stance and gait. Advances in Neurology. 2001;87:225–233. - PubMed