. 2010 Aug;12(8):844-54.
doi: 10.1093/neuonc/noq004. Epub 2010 Feb 5.

Fatty acid synthase as a novel target for meningioma therapy

Affiliations

Fatty acid synthase as a novel target for meningioma therapy

Daniela Haase et al. Neuro Oncol. 2010 Aug.

Abstract

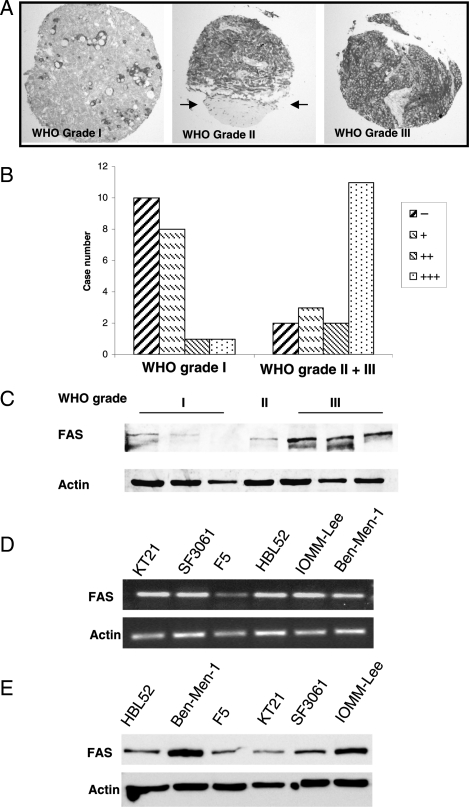
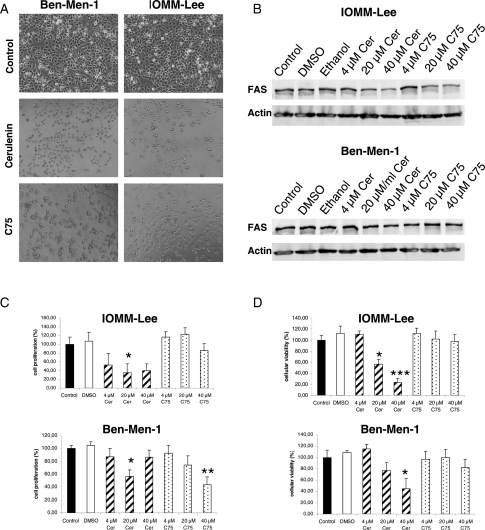
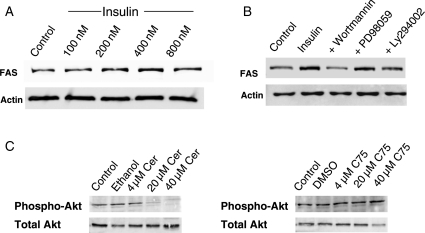
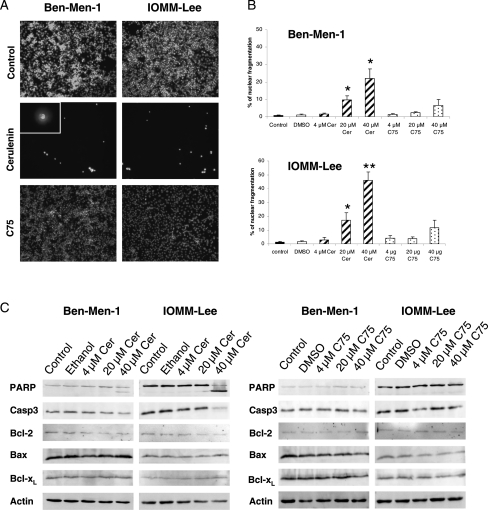
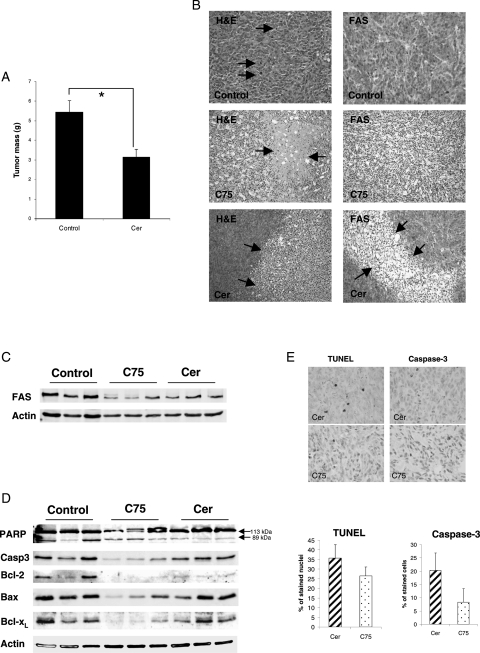
High levels of fatty acid synthase (FAS) expression have been reported in hormone receptor-positive tumors, including prostate, breast, and ovarian cancers, and its inhibition reduces tumor growth in vitro and in vivo. Similar to other hormone receptor-positive tumor types, meningiomas are progesterone receptor- and estrogen receptor-immunoreactive brain tumors. To define the role of FAS in human meningioma growth control, we first analyzed the FAS expression using a tissue microarray containing 38 meningiomas and showed increased FAS expression in 70% of atypical WHO grade II and anaplastic WHO grade III meningiomas compared with 10% of benign WHO grade I tumors. We next confirmed this finding by real-time PCR and Western blotting. Second, we demonstrated that treatment with the FAS inhibitor, cerulenin (Cer), significantly decreased meningioma cell survival in vitro. Third, we showed that Cer treatment reduced FAS expression by modulating Akt phosphorylation (activation). Fourth, we demonstrated that Cer treatment of mice bearing meningioma xenografts resulted in significantly reduced tumor volumes associated with increased meningioma cell death. Collectively, our data suggest that the increased FAS expression in human meningiomas represents a novel therapeutic target for the treatment of unresectable or malignant meningioma.


Figures

Fig. 1.
Fig. 1.
Expression of fatty acid synthase (FAS) in human meningioma samples. (A) Immunodetection of FAS in biopsy samples using a tissue microarray (TMA) comprising 38 meningioma specimens of different grades of malignancy. Left: In benign meningiomas WHO grade I, FAS expression is focally concentrated around pseudopsammoma bodies. Middle: FAS immunoexpression is increased in an atypical grade II meningioma. The upper part shows the tumor tissue with strong FAS immunopositivity, while the adjacent normal meningeal tissue (arrows) does completely lack FAS expression. Right: Strong diffuse FAS expression in an anaplastic meningioma WHO grade III. (B) Semiquantitative analysis of FAS immunoexpression in the 38 TMA samples reveales a significantly increased number (Chi-square test: P < 0.01) of meningiomas with moderate (++) or strong (++ +) FAS positivity among aggressive WHO grade II and III meningiomas, while in 18 of 20 benign meningiomas, FAS immunoexpression is absent (−) or weak (+). (C) Western blot analyses of FAS protein expression show an increase of FAS amount in atypical (GII) and anaplastic (GIII) meningiomas compared to benign GI tumors. (D) Characterization of FAS expression and function in different benign and malignant meningioma cell lines by RT-PCR and Western blot analysis (E), revealing strong FAS protein expression especially in Ben-Men-1 and IOMM-Lee cells.
Fig. 2.
Fig. 2.
FAS inhibition by Cer and C75 in human meningioma cells. (A) Representative pictures of Ben-Men-1 (left panel) and IOMM-Lee (right panel) cells following treatment with 40 µM Cer (middle figures) or 40 µM C75 (lower figures) compared with untreated cells. It is clearly seen that the density of surviving cells is reduced in cells treated with both inhibitors, while effects appear to be stronger in IOMM-Lee cells and by Cer compared with C75 treatment, respectively. (B) FAS protein levels in IOMM-Lee cells are significantly reduced by Cer and C75 treatment (upper figure), while Ben-Men-1 cells do not show reduced FAS levels following treatment with both inhibitors (lower figure). FAS levels of both cell lines are not affected by the solvent DMSO or ethanol. (C) Effect of Cer and C75 on meningioma cell proliferation. While in Ben-Men-1 cells only moderate effects are seen following treatment with C75 or Cer (lower figure), Cer but not C75 does significantly reduce cell proliferation in malignant IOMM-Lee cells (upper figure)(*P < 0.05; **P < 0.01). (D) Survival of meningioma cells is significantly reduced by Cer treatment in both IOMM-Lee (upper figure) and Ben-Men-1 (lower figure) cells, while C75 is not effective (*P < 0.05; ***P < 0.001). Data are derived from 3 independent experiments.
Fig. 3.
Fig. 3.
FAS expression can be induced in serum-starved IOMM-Lee cells by insulin stimulation (A). Inhibition of PI3K signaling by wortmannin or Ly294002 effectively downregulates the FAS levels in serum-starved IOMM-Lee cells stimulated with insulin, while inhibition of MAPK/ERK signaling by PD98059 has no effect on FAS protein expression (B). Comparable data were seen in Ben-Men-1 cells (not shown). (C) Effects of the FAS inhibitors Cer and C75 on PI3 kinase/Akt phosphorylation levels. While IOMM-Lee cells show cleary reduced phospho-Akt levels following Cer treatment (left figures), C75 is not effective (right figures). Comparable data were achieved for Ben-Men-1 cells (not shown).
Fig. 4.
Fig. 4.
FAS inhibitors induce apoptotic cell death in meningioma cells. (A) Representative nuclear fragmentation pictures of Ben-Men-1 and IOMM-Lee cells following treatment with 40 Cer or 40 µM C75 compared with untreated cells. A strong reduction in number of nuclei and a broad nuclear fragmentation is seen in case of Cer-treated (middle figures) cells. The inset shows magnification of nuclear fragmentation. (B) Quantification of nuclear fragmentation using HOECHST 33258 staining following application of FAS inhibitors shows a significant increase of apoptotic nuclear figures especially in malignant IOMM-Lee cells (lower figure; *P < 0.05; **P < 0.01) and less pronounced in Ben-Men-1 cells (upper figure; *P < 0.05) following Cer treatment. In contrast, C75 causes only minor increases in the rate of meningioma cell nuclei fragmentation. Data are derived from 3 independent experiments. (C) Levels of the apoptosis-related proteins PARP, caspase-3, and Bcl-2 are dose dependently reduced by Cer in IOMM-Lee cells but not in Ben-Men-1 cells (left figures), while Bcl-xL and Bax levels are not affected. In contrast, C75 does not change the protein levels of apoptosis-related proteins (right figures).
Fig. 5.
Fig. 5.
Inhibition of FAS affects meningioma tumor growth in vivo. (A) After a 4-week treatment period, Cer-treated animals show significantly lower tumor mass compared with control animals (*P < 0.05). (B) Histological (left panel) and immunohistochemical (right panel) analyses of mouse xenografts show reduced cell density and large necroses in Cer- or C75-treated animals, respectively. Control tumors show a high rate of proliferation as indicated by frequent mitoses (arrows). Immunohistochemistry shows that FAS protein levels are reduced especially in C75-treated animals. (C) Both Cer and C75 treatment reduce intratumoral FAS levels as determined by Western blotting. (D) Determination of apoptosis-related factors in tumors from treated animals and controls. C75-treated animals show clear apoptosis induction by changed protein levels of PARP, caspase-3, Bcl-2, Bax, and Bcl-xL. Cer-treated animals show apoptosis induction to a lesser extent compared with controls. (E) Quantification of apoptosis in Cer- and C75-treated xenografts by TUNEL assays and staining of active caspase-3. Representative immunostainings are shown in the upper figure. Lower figures show the percentage of stained tumor cells in both groups (differences are not statistically significant).

References

    1. Louis DN, Ohgaki H, Wiestler OD, et al. The 2007 WHO classification of tumours of the central nervous system. Acta Neuropathol. 2007;114:97–109. - PMC - PubMed
    1. Gutmann DH, Giordano MJ, Fishback AS, Guha A. Loss of merlin expression in sporadic meningiomas, ependymomas and schwannomas. Neurology. 1997;49:267–270. - PubMed
    1. Weber RG, Bostrom J, Wolter M, et al. Analysis of genomic alterations in benign, atypical, and anaplastic meningiomas: toward a genetic model of meningioma progression. Proc Natl Acad Sci USA. 1997;94:14719–14724. - PMC - PubMed
    1. Bostrom J, Meyer-Puttlitz B, Wolter M, et al. Alterations of the tumor suppressor genes CDKN2A (p16(INK4a)), p14(ARF), CDKN2B (p15(INK4b)), and CDKN2C (p18(INK4c)) in atypical and anaplastic meningiomas. Am J Pathol. 2001;159:661–669. - PMC - PubMed
    1. Perry A, Gutmann DH, Reifenberger G. Molecular pathogenesis of meningiomas. J Neurooncol. 2004;70:183–202. - PubMed

Publication types

MeSH terms