

Fragrant dioxane derivatives identify beta1-subunit-containing GABAA receptors
- PMID: 20511229
- PMCID: PMC2911342
- DOI: 10.1074/jbc.M110.103309
Fragrant dioxane derivatives identify beta1-subunit-containing GABAA receptors
Abstract
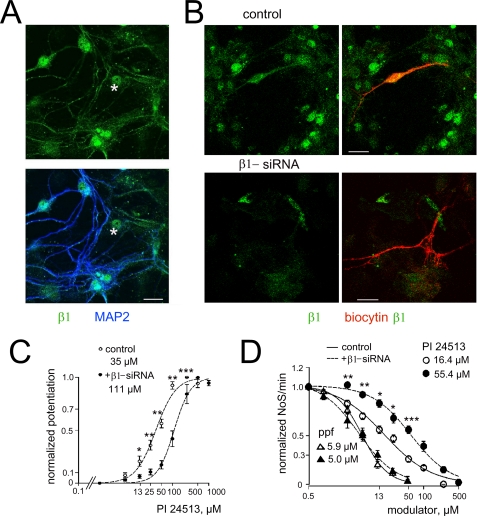
Nineteen GABA(A) receptor (GABA(A)R) subunits are known in mammals with only a restricted number of functionally identified native combinations. The physiological role of beta1-subunit-containing GABA(A)Rs is unknown. Here we report the discovery of a new structural class of GABA(A)R positive modulators with unique beta1-subunit selectivity: fragrant dioxane derivatives (FDD). At heterologously expressed alpha1betaxgamma2L (x-for 1,2,3) GABA(A)R FDD were 6 times more potent at beta1- versus beta2- and beta3-containing receptors. Serine at position 265 was essential for the high sensitivity of the beta1-subunit to FDD and the beta1N286W mutation nearly abolished modulation; vice versa the mutation beta3N265S shifted FDD sensitivity toward the beta1-type. In posterior hypothalamic neurons controlling wakefulness GABA-mediated whole-cell responses and GABAergic synaptic currents were highly sensitive to FDD, in contrast to beta1-negative cerebellar Purkinje neurons. Immunostaining for the beta1-subunit and the potency of FDD to modulate GABA responses in cultured hypothalamic neurons was drastically diminished by beta1-siRNA treatment. In conclusion, with the help of FDDs we reveal a functional expression of beta1-containing GABA(A)Rs in the hypothalamus, offering a new tool for studies on the functional diversity of native GABA(A)Rs.
Figures


Similar articles
-
GABAA receptors involved in sleep and anaesthesia: β1- versus β3-containing assemblies.Pflugers Arch. 2012 Jan;463(1):187-99. doi: 10.1007/s00424-011-0988-4. Epub 2011 Jul 7. Pflugers Arch. 2012. PMID: 21735059
-
GABAA receptor modulation by the novel intravenous general anaesthetic E-6375.Neuropharmacology. 2003 Dec;45(8):1029-40. doi: 10.1016/s0028-3908(03)00299-5. Neuropharmacology. 2003. PMID: 14614946
-
Functional characterization of the antiepileptic drug candidate, padsevonil, on GABAA receptors.Epilepsia. 2020 May;61(5):914-923. doi: 10.1111/epi.16497. Epub 2020 Apr 16. Epilepsia. 2020. PMID: 32297665 Free PMC article.
-
Potency of GABA at human recombinant GABA(A) receptors expressed in Xenopus oocytes: a mini review.Amino Acids. 2013 Apr;44(4):1139-49. doi: 10.1007/s00726-012-1456-y. Epub 2013 Feb 6. Amino Acids. 2013. PMID: 23385381 Review.
-
The GABA A receptor subunits heterologously expressed in Xenopus oocytes.Mini Rev Med Chem. 2013 Apr 1;13(5):744-8. doi: 10.2174/1389557511313050011. Mini Rev Med Chem. 2013. PMID: 23373649 Review.
Cited by
-
A novel GABA(A) receptor pharmacology: drugs interacting with the α(+) β(-) interface.Br J Pharmacol. 2012 May;166(2):476-85. doi: 10.1111/j.1476-5381.2011.01779.x. Br J Pharmacol. 2012. PMID: 22074382 Free PMC article. Review.
-
Identification of amino acids involved in histamine potentiation of GABA A receptors.Front Pharmacol. 2015 May 26;6:106. doi: 10.3389/fphar.2015.00106. eCollection 2015. Front Pharmacol. 2015. PMID: 26074818 Free PMC article.
-
GABAA receptors in GtoPdb v.2021.3.IUPHAR BPS Guide Pharm CITE. 2021 Sep 2;2021(3):10.2218/gtopdb/F72/2021.3. doi: 10.2218/gtopdb/F72/2021.3. IUPHAR BPS Guide Pharm CITE. 2021. PMID: 35005623 Free PMC article.
-
Alterations in Purkinje cell GABAA receptor pharmacology following oxygen and glucose deprivation and cerebral ischemia reveal novel contribution of β1 -subunit-containing receptors.Eur J Neurosci. 2013 Feb;37(4):555-63. doi: 10.1111/ejn.12064. Epub 2012 Nov 26. Eur J Neurosci. 2013. PMID: 23176253 Free PMC article.
-
α4βδ GABA(A) receptors are high-affinity targets for γ-hydroxybutyric acid (GHB).Proc Natl Acad Sci U S A. 2012 Aug 14;109(33):13404-9. doi: 10.1073/pnas.1204376109. Epub 2012 Jul 2. Proc Natl Acad Sci U S A. 2012. PMID: 22753476 Free PMC article.
References
-
- Sigel E. (2002) Curr. Top. Med. Chem. 2, 833–839 - PubMed
-
- Baumann S. W., Baur R., Sigel E. (2002) J. Biol. Chem. 277, 46020–46025 - PubMed
-
- Bateson A. N. (2004) Sleep Med. 5, Suppl. 1, S9–S15 - PubMed
-
- Krasowski M. D., Koltchine V. V., Rick C. E., Ye Q., Finn S. E., Harrison N. L. (1998) Mol. Pharmacol. 53, 530–538 - PubMed
Publication types
MeSH terms
Substances
LinkOut - more resources
Full Text Sources
Other Literature Sources
Molecular Biology Databases
