. 2010 Jun;133(Pt 6):1668-81.
doi: 10.1093/brain/awq112.

Heterogeneous neuronal firing patterns during interictal epileptiform discharges in the human cortex

Affiliations

Heterogeneous neuronal firing patterns during interictal epileptiform discharges in the human cortex

Corey J Keller et al. Brain. 2010 Jun.

Abstract

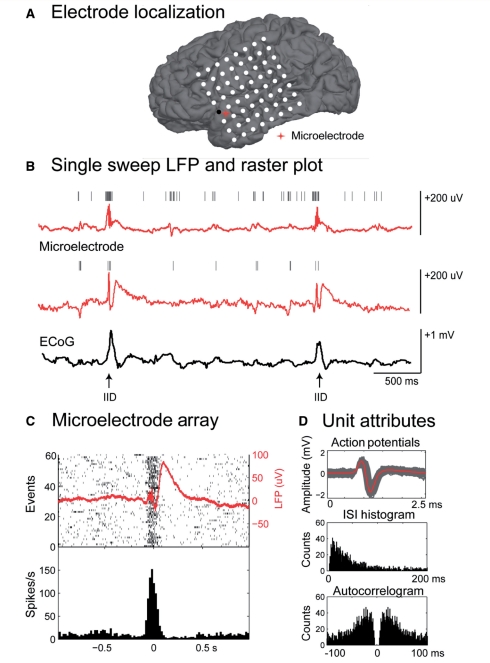
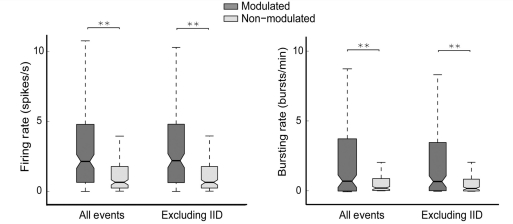
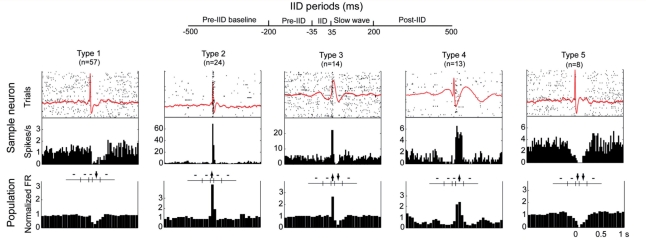
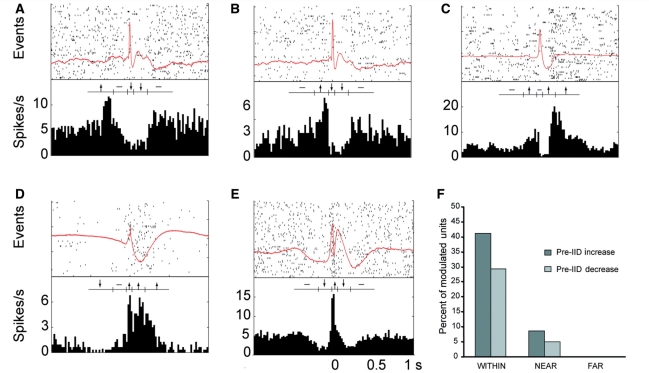
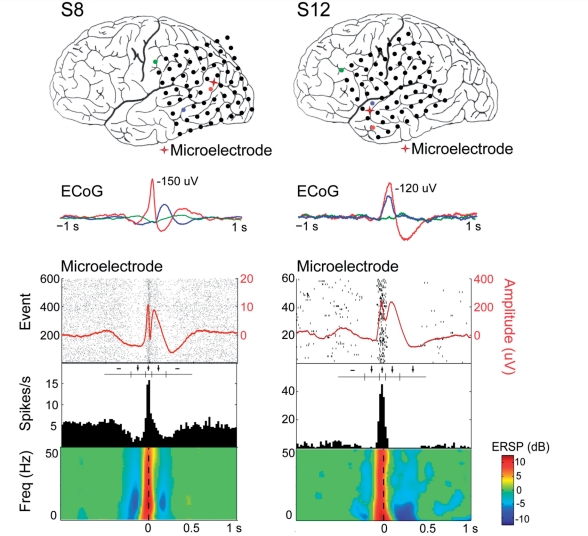
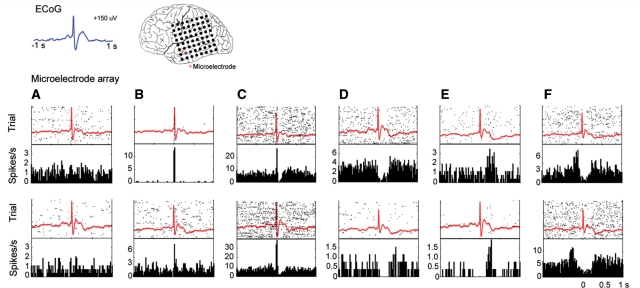
Epileptic cortex is characterized by paroxysmal electrical discharges. Analysis of these interictal discharges typically manifests as spike-wave complexes on electroencephalography, and plays a critical role in diagnosing and treating epilepsy. Despite their fundamental importance, little is known about the neurophysiological mechanisms generating these events in human focal epilepsy. Using three different systems of microelectrodes, we recorded local field potentials and single-unit action potentials during interictal discharges in patients with medically intractable focal epilepsy undergoing diagnostic workup for localization of seizure foci. We studied 336 single units in 20 patients. Ten different cortical areas and the hippocampus, including regions both inside and outside the seizure focus, were sampled. In three of these patients, high density microelectrode arrays simultaneously recorded between 43 and 166 single units from a small (4 mm x 4 mm) patch of cortex. We examined how the firing rates of individual neurons changed during interictal discharges by determining whether the firing rate during the event was the same, above or below a median baseline firing rate estimated from interictal discharge-free periods (Kruskal-Wallis one-way analysis, P<0.05). Only 48% of the recorded units showed such a modulation in firing rate within 500 ms of the discharge. Units modulated during the discharge exhibited significantly higher baseline firing and bursting rates than unmodulated units. As expected, many units (27% of the modulated population) showed an increase in firing rate during the fast segment of the discharge (+ or - 35 ms from the peak of the discharge), while 50% showed a decrease during the slow wave. Notably, in direct contrast to predictions based on models of a pure paroxysmal depolarizing shift, 7.7% of modulated units recorded in or near the seizure focus showed a decrease in activity well ahead (0-300 ms) of the discharge onset, while 12.2% of units increased in activity in this period. No such pre-discharge changes were seen in regions well outside the seizure focus. In many recordings there was also a decrease in broadband field potential activity during this same pre-discharge period. The different patterns of interictal discharge-modulated firing were classified into more than 15 different categories. This heterogeneity in single unit activity was present within small cortical regions as well as inside and outside the seizure onset zone, suggesting that interictal epileptiform activity in patients with epilepsy is not a simple paroxysm of hypersynchronous excitatory activity, but rather represents an interplay of multiple distinct neuronal types within complex neuronal networks.


Figures

Figure 1
Figure 1
Relationship between macroelectrodes, microelectrodes and single unit activity during an interictal discharge. (A) Co-registration of pre-operative MRI and post-operative CT or MRI allows identification of the electrodes and anatomical structures. (B) Single sweep of microelectrode local field potential (LFP; red) and corticography (ECoG; black) from an adjacent electrode. Hash marks indicate discriminated action potentials. Selected interictal discharges (IID) are indicated with arrows. Note the increase in action potentials from both units during the fast component of the interictal discharge. (C) Raster plot and peri-spike timing histogram from one of the microelectrode channels shown above during the interictal discharge (n = 60). The averaged local field potential is overlaid on the raster plot in red. Histogram bin width is 5 ms. (D) Unit attributes: action potentials (each in grey, average in red), neuronal inter-spike time interval (ISI) histogram (1 ms bin width) and autocorrelogram (−100 to 100 ms; 1 ms bin width) from the unit isolated in (C).
Figure 2
Figure 2
Firing and bursting rate for neurons modulated or not during the interictal discharge. Boxplots show the median (Med, ×5), lower (Q1, ×25) and upper quartile (Q3, ×75) in the shaded regions and the largest non-outlier observations (whiskers shown with dotted lines). The modulated population had significantly higher firing and bursting rates compared to the non-modulated population both including and excluding the interictal event (Med modulated = 2.56 spikes/s and 0.65 bursts/min; Med non-modulated = 1.02 spikes/s and 0.20 bursts/min; **P < 0.01, Kruskal–Wallis test, n1 = 158, n2 = 178). IID = interictal discharge.
Figure 3
Figure 3
Classification of neuronal responses during the interictal discharge (IID). Five defined interictal discharge periods are shown in the schematic at top. The averaged local field potential, raster plot and peri-event time histogram of a sample neuron and the population average peri-event time histogram of the top five modulated firing patterns around the interictal event are shown in each column. FR = firing rate. Dashes indicate no significant change and arrows up or down denote an increase or decrease in significance in the middle diagrams (P < 0.05, Kruskal–Wallis test, Bonferroni corrected).
Figure 4
Figure 4
Neuronal units whose firing changes preceded the interictal discharge (IID). Examples of units that (A) increase long before, (B) increase just before, (C) increase after, (D) decrease long before and (E) decrease just before the interictal discharge. (F) Histogram of percent of modulated units which show an increase or decrease before the interictal discharge in regions which were within, near or far from the seizure onset zone.
Figure 5
Figure 5
Transient decrease in both local field potential spectral power and neuronal firing rates precede interictal discharges. Upper panels show the average LFP (red) overlaid on raster plots of neuronal firing. Below is the peri-event time histogram and then time-frequency plots of the LFP (non-significant values are plotted in green. Red indicates a significant increase and blue indicates a decrease (P < 0.01). The two columns are from two different patients.
Figure 6
Figure 6
Neuronal responses are variable in a small cortical region. All 12 units in this analysis were found within 2.5 mm at the same depth in cortex and therefore, the same cortical layer. In each plot, the top panel shows the raster plot (60 events) overlaid with the average local field potential. The lower panel shows the peri-event time histogram. Each column shows examples of similar firing patterns in two different units. Neuronal responses to the interictal discharge were seen that (A) did not change, (B) increased during the fast component, (C) increased during the fast component and decreased during the slow wave, (D) did not change during the fast component but decreased during the wave, (E) increased after the IID peak and wave, and (F) increased before the fast component of the interictal discharge.

References

    1. Altafullah I, Halgren E, Stapleton JM, Crandall PH. Interictal spike-wave complexes in the human medial temporal lobe: typical topography and comparisons with cognitive potentials. Electroencephalogr Clin Neurophysiol. 1986;63:503–16. - PubMed
    1. Amirnovin R, Williams ZM, Cosgrove GR, Eskandar EN. Visually guided movements suppress subthalamic oscillations in Parkinson's disease patients. J Neurosci. 2004;24:11302–6. - PMC - PubMed
    1. Amzica F, Steriade M. Electrophysiological correlates of sleep delta waves. Electroencephalogr Clin Neurophysiol. 1998;107:69–83. - PubMed
    1. Babb TL, Carr E, Crandall PH. Analysis of extracellular firing patterns of deep temporal lobe structures in man. Electroencephalogr Clin Neurophysiol. 1973;34:247–57. - PubMed
    1. Babb TL, Crandall PH. Epileptogenesis of human limbic neurons in psychomotor epileptics. Electroencephalogr Clin Neurophysiol. 1976;40:225–43. - PubMed

Publication types