. 2010 May;22(5):1498-515.
doi: 10.1105/tpc.109.071001. Epub 2010 May 28.

Plastidial thioredoxin z interacts with two fructokinase-like proteins in a thiol-dependent manner: evidence for an essential role in chloroplast development in Arabidopsis and Nicotiana benthamiana

Affiliations

Plastidial thioredoxin z interacts with two fructokinase-like proteins in a thiol-dependent manner: evidence for an essential role in chloroplast development in Arabidopsis and Nicotiana benthamiana

Borjana Arsova et al. Plant Cell. 2010 May.

Abstract

Here, we characterize a plastidial thioredoxin (TRX) isoform from Arabidopsis thaliana that defines a previously unknown branch of plastidial TRXs lying between x- and y-type TRXs and thus was named TRX z. An Arabidopsis knockout mutant of TRX z had a severe albino phenotype and was inhibited in chloroplast development. Quantitative real-time RT-PCR analysis of the mutant suggested that the expressions of genes that depend on a plastid-encoded RNA polymerase (PEP) were specifically decreased. Similar results were obtained upon virus-induced gene silencing (VIGS) of the TRX z ortholog in Nicotiana benthamiana. We found that two fructokinase-like proteins (FLN1 and FLN2), members of the pfkB-carbohydrate kinase family, were potential TRX z target proteins and identified conserved Cys residues mediating the FLN-TRX z interaction. VIGS in N. benthamiana and inducible RNA interference in Arabidopsis of FLNs also led to a repression of PEP-dependent gene transcription. Remarkably, recombinant FLNs displayed no detectable sugar-phosphorylating activity, and amino acid substitutions within the predicted active site imply that the FLNs have acquired a new function, which might be regulatory rather than metabolic. We were able to show that the FLN2 redox state changes in vivo during light/dark transitions and that this change is mediated by TRX z. Taken together, our data strongly suggest an important role for TRX z and both FLNs in the regulation of PEP-dependent transcription in chloroplasts.


Figures

Figure 1.
Figure 1.
Characterization of At3g06730 as a Plastidial Thioredoxin. (A) Subcellular localization of GFP alone (free GFP) or of a fusion between the first 81 amino acids of At3g06730 and GFP (TRX z TP: GFP) in tobacco leaves transiently transformed by Agrobacterium infiltration. The green fluorescence of GFP (left) and the red autofluorescence of chlorophyll (Chl, middle) were monitored separately using a confocal laser scanning microscope, and the two fluorescence images were merged (right). Bars = 10 μm. (B) Measurement of disulfide reductase activity of recombinant His-tagged At3g06730 using the turbidimetric assay of insulin reduction. The incubation mixture contained 2 or 5 μM His-tagged At3g06730 protein lacking the predicted chloroplast targeting peptide. As a positive control, insulin reduction by 0.5 μM thioredoxin from E. coli was assayed. The nonenzymatic insulin reduction by DTT served as a negative control. (C) Phylogenetic tree of plastidial and mitochondrial thioredoxins from Arabidopsis. At3g06730 occupies a position close to TRX x and y and thus was named TRX z. The phylogenetic tree was constructed using MEGA 4 with the neighbor-joining method. Bootstrap values calculated from 1000 trials are shown at each node. The extent of divergence according to the scale (relative units) is indicated at the bottom. Predicted mature polypeptides lacking the putative transit peptide were employed for tree construction. The alignment used for this analysis is available as Supplemental Data Set 1 online.
Figure 2.
Figure 2.
Characterization of Arabidopsis and N. benthamiana Plants with Reduced TRX z Expression. (A) Molecular analysis of the trx z Arabidopsis T-DNA insertion mutant. The T-DNA insertion site and primer (LP, RP, and LB1.3) locations are indicated. PCR on genomic DNA revealed a homozygous insertion in the TRX z locus. Expression of TRX z transcript was shown by RT-PCR with gene-specific primer sets. Ubiquitin (UBQ) served as an internal control. (B) Wild-type (WT; Col-0), trx z, and complemented (35S:TRX z/trx z) Arabidopsis plants. Three-week-old plants were grown on MS agar plates (Col-0 and trx z) or in soil (35S:TRX z/trx z), and their visible phenotype was observed. (C) Chlorotic phenotype of TRV:TRX z N. benthamiana VIGS plants compared with control specimen (TRV:GFPsil). Photographs of leaves and whole plants were taken 14 d after inoculation (left). Transcript accumulation of TRX z, TRX x, and TRX f1 in TRV:TRX z and control plants was analyzed by RT-PCR (right).
Figure 3.
Figure 3.
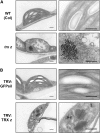
Transmission Electron Micrographs of Plastids in Arabidopsis and N. benthamiana Plants with Reduced TRX z Function. (A) Arabidopsis wild type (WT; Col-0) and trx z. (B) N. benthamiana TRX:TRX z versus TRV:GFPsil control. Images on the right are a close-up of the same plastids shown on the left side. Bars = 0.5 μm.
Figure 4.
Figure 4.
Changes in Transcript Abundance of Plastome-Encoded and Nucleus-Encoded Genes in Arabidopsis trx z and N. benthamiana TRV:TRX z Plants. The log2 (mutant [mut]/wild type [wt]) value is given, where 3.32 corresponds to a 10-fold upregulation and −3.32 to a 10-fold downregulation in the mutant or transgenic plant relative to its control. n.d., not detectable. I, class I genes; II, class II genes; III, class III genes; white bars, TRV:TRX z; gray bars, trx z. Error bars indicate sd (n = 3). 18S rRNA was used as a reference. Significant differences between Arabidopsis trx z/TRV:TRX z plants and the respective control plants were calculated using Student's t test and are indicated by *P < 0.05 and **P < 0.01.
Figure 5.
Figure 5.
Interaction of TRX z with FLN1 and FLN2 in Yeast Two-Hybrid Assays. The predicted mature TRX z protein fused to the GAL4 DNA binding domain (BD) was expressed in combination with either FLN1 (amino acids 8 to 471) or FLN2 (amino acids 176 to 616) fused to the GAL4 activation domain (AD) in yeast strain AH109. Cells were grown on selective media before a lacZ filter assay was performed. Empty BD and AD vectors served as negative controls. –LT, yeast growth on medium without Leu and Trp. –HTL, yeast growth on medium lacking His, Leu, and Trp, indicating expression of the HIS3 reporter gene. β-Gal, activity of the lacZ reporter gene. [See online article for color version of this figure.]
Figure 6.
Figure 6.
Subcellular Localization of FLN Proteins and TRX z–FLN Interaction. (A) Subcellular localization of FLN1:YFP and FLN2:YFP fusions in tobacco leaves transiently transformed by particle bombardment. The yellow fluorescence of YFP (left) and the red autofluorescence of chlorophyll (Chl, middle) were monitored separately, and the two fluorescence images were merged (right). Bars = 10 μm. (B) Colocalization of FLN:YFP fusion proteins (yellow) and PEND:CFP (blue) with chloroplast nucleoids. The arrowhead indicates the large fluorescent spot that represents the nucleus (n) of a guard cell. Bars = 10 μm. (C) Visualization of protein interactions in plastids by the BiFC assay. YFP confocal microscopy images show tobacco leaf epidermal cells transiently expressing constructs encoding the fusion proteins indicated. Merge indicates an overlay of the YFP and chlorophyll autofluorescence images. Each image is representative of at least two experiments. Bars = 10 μm.
Figure 7.
Figure 7.
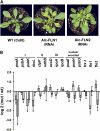
Silencing of FLN1 and FLN2 in Arabidopsis Using Ethanol-Inducible RNAi. (A) Phenotype of transgenic Arabidopsis plants 5 d after ethanol treatment compared with the wild-type (WT) control. (B) Changes in transcript abundance of plastome-encoded and nucleus-encoded genes in Arabidopsis FLN1 and FLN2 iRNAi plants. The log2 (mutant [mut]/wild type [wt]) value is given, where 3.32 corresponds to a 10-fold upregulation and −3.32 to a 10-fold downregulation in the iRNAi plants relative to the wild type. n.d., not detectable. I, class I genes; II, class II genes; III, class III genes; white bars, iRNAi FLN1; gray bars, iRNAi FLN2. Error bars indicate sd (n = 3). 18S rRNA was used as a reference. Significant differences between Arabidopsis iRNAi FLN plants and the wild type were calculated using Student's t test and are indicated by *P < 0.05 and **P < 0.01.
Figure 8.
Figure 8.
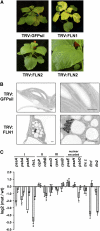
Silencing of FLN1 Expression in N. benthamiana Using TRV-Based VIGS. (A) Phenotype of N. benthamiana FLN-1 (top right) and FLN-2 (bottom) VIGS plants in comparison to the TRV:GFPsil control. (B) Transmission electron micrographs of plastids from N. benthamiana VIGS FLN1 plants (TRV:FLN1). Bars = 0.5 μm. (C) Changes in transcript abundance of plastome-encoded and nucleus-encoded genes in N. benthamiana FLN-1 and FLN-2 VIGS plants. The log2 (mutant [mut]/wild type [wt]) value is given, where 3.32 corresponds to a 10-fold upregulation and −3.32 to a 10-fold downregulation in the VIGS FLN plants compared with the control. n.d., not detectable. I, class I genes; II, class II genes; III, class III genes; white bars, VIGS FLN1; gray bars, VIGS FLN2. Error bars indicate sd (n = 3). 18S rRNA was used as a reference. Significant differences between FLN1/FLN2 VIGS plants and control plants were calculated using Student's t test and are indicated by *P < 0.05 and **P < 0.01.
Figure 9.
Figure 9.
The in Planta Redox State of FLN2 Is Modulated by Light/Dark Transitions in a TRX z–Dependent Manner. Leaf material was harvested from Arabidopsis Col-0 wild-type (WT) or trx z mutant plants either during the light (L) or after 1 h of darkening (D). Samples were subjected to either reducing (+DTT) or nonreducing (−DTT) SDS-PAGE, and the FLN2 protein was detected using a FLN2-specific antibody (top panel). The position of the FLN2 band is indicated by an arrow. The asterisk marks a nonspecific cross-reacting band. An identically loaded gel was run in parallel and stained with Coomassie blue as a loading control (bottom panel). The figure shows a representative result of three repetitions using independent biological material.

Comment in

References

    1. Alkhalfioui F., Renard M., Vensel W.H., Wong J., Tanaka C.K., Hurkman W.J., Buchanan B.B., Montrichard F. (2007). Thioredoxin-linked proteins are reduced during germination of Medicago truncatula seeds. Plant Physiol. 144: 1559–1579 - PMC - PubMed
    1. Altschul S.F., Gish W., Miller W., Myers E.W., Lipman D.J. (1990). Basic local alignment search tool. J. Mol. Biol. 215: 403–410 - PubMed
    1. Balmer Y., Koller A., del Val G., Manieri W., Schürmann P., Buchanan B.B. (2003). Proteomics gives insight into the regulatory function of chloroplast thioredoxins. Proc. Natl. Acad. Sci. USA 100: 370–375 - PMC - PubMed
    1. Balmer Y., Koller A., Val G.D., Schürmann P., Buchanan B.B. (2004a). Proteomics uncovers proteins interacting electrostatically with thioredoxin in chloroplasts. Photosynth. Res. 79: 275–280 - PubMed
    1. Balmer Y., Vensel W.H., Cai N., Manieri W., Schürmann P., Hurkman W.J., Buchanan B.B. (2006). A complete ferredoxin/thioredoxin system regulates fundamental processes in amyloplasts. Proc. Natl. Acad. Sci. USA 103: 2988–2993 - PMC - PubMed

Publication types

MeSH terms