. 2010 Oct;9(10):2195-204.
doi: 10.1074/mcp.M110.000992. Epub 2010 May 28.

Optimizing a proteomics platform for urine biomarker discovery

Affiliations

Optimizing a proteomics platform for urine biomarker discovery

Maryam Afkarian et al. Mol Cell Proteomics. 2010 Oct.

Abstract

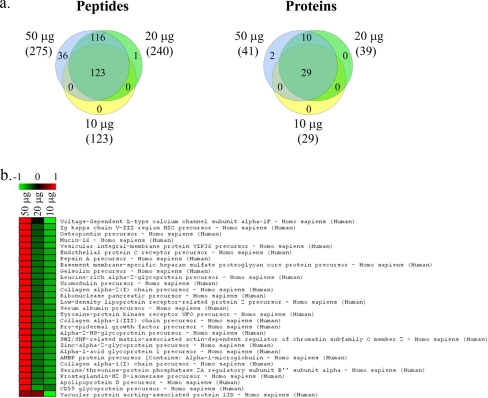
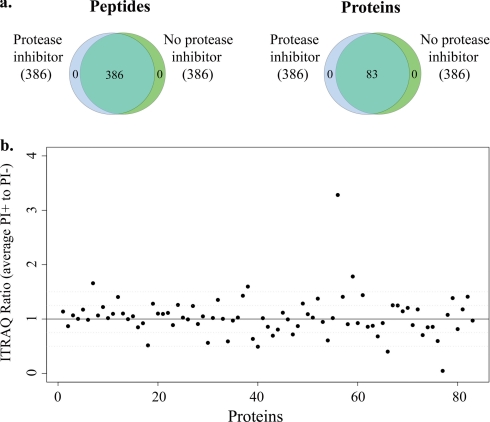
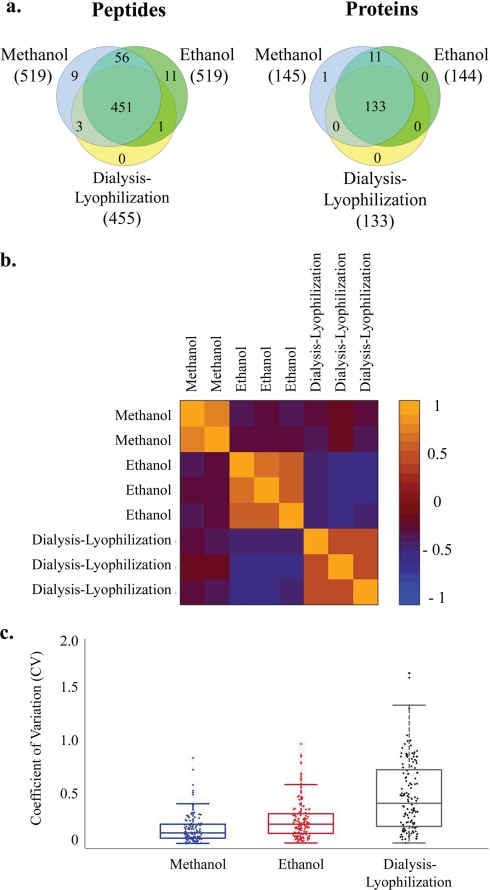
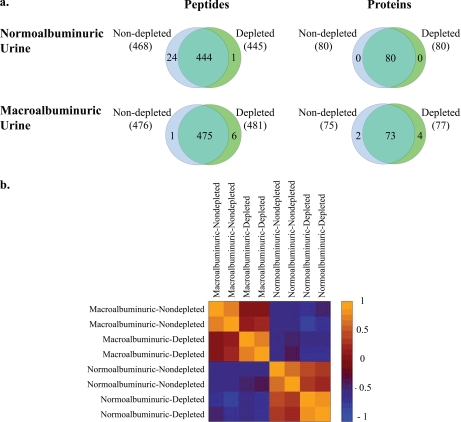
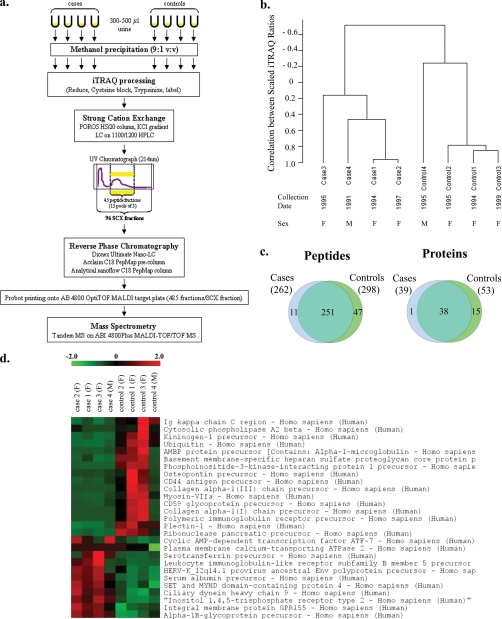
Biomarker discovery approaches in urine have been hindered by concerns for reproducibility and inadequate standardization of proteomics protocols. In this study, we describe an optimized quantitative proteomics strategy for urine biomarker discovery, which is applicable to fresh or long frozen samples. We used urine from healthy controls to standardize iTRAQ (isobaric tags for relative and absolute quantitation) for variation induced by protease inhibitors, starting protein and iTRAQ label quantities, protein extraction methods, and depletion of albumin and immunoglobulin G (IgG). We observed the following: (a) Absence of protease inhibitors did not affect the number or identity of the high confidence proteins. (b) Use of less than 20 μg of protein per sample led to a significant drop in the number of identified proteins. (c) Use of as little as a quarter unit of an iTRAQ label did not affect the number or identity of the identified proteins. (d) Protein extraction by methanol precipitation led to the highest protein yields and the most reproducible spectra. (e) Depletion of albumin and IgG did not increase the number of identified proteins or deepen the proteome coverage. Applying this optimized protocol to four pairs of long frozen urine samples from diabetic Pima Indians with or without nephropathy, we observed patterns suggesting segregation of cases and controls by iTRAQ spectra. We also identified several previously reported candidate biomarkers that showed trends toward differential expression, albeit not reaching statistical significance in this small sample set.


Figures

Fig. 1.
Fig. 1.
Titration of starting protein quantity. a, Venn diagrams represent numbers and overlap in identities of peptides or proteins identified in samples with starting protein quantities of 50, 20, and 10 μg. The numbers in parentheses represent the number of identified proteins (and peptides) for each sample type. The peptide Venn diagram displays the number of unique peptides with ≥20% confidence that are used in identifying and quantitating the proteins. b, colorgram depicting iTRAQ ratios for proteins identified in samples with starting protein quantities of 50, 20, and 10 μg. The columns represent individual samples; rows represent identified proteins. iTRAQ ratios are shown on a pseudocolor scale with red denoting high ratios and green denoting low ratios.
Fig. 2.
Fig. 2.
Protease inhibitors. a, number and identity of peptides and proteins identified in urine samples collected with or without addition of protease inhibitors. The numbers in parentheses represent the number of identified proteins (and peptides) for each sample type. The peptide Venn diagram displays the number of unique peptides with ≥20% confidence that are used in identifying and quantitating the proteins. b, ratio of iTRAQ intensity for each of the 83 identified proteins in PI+ samples (with protease inhibitors) to PI samples (without protease inhibitors).
Fig. 3.
Fig. 3.
Protein extraction methods. a, number and overlap in identity of peptides and proteins identified in urine extracted with methanol versus ethanol versus dialysis-lyophilization. The numbers in parentheses represent the number of identified proteins (or peptides) for each sample type. The peptide Venn diagram displays the number of unique peptides with ≥20% confidence that are used in identifying and quantitating the proteins. b, correlation in iTRAQ intensities between samples extracted with methanol, ethanol, or dialysis-lyophilization. The values represent the Pearson correlation for normalized iTRAQ values ((iTRAQ value − mean)/S.D.) of all proteins between two samples. c, Box-and-whisker plots depicting the observed range for the coefficients of variation (CV) for iTRAQ ratios between replicate samples extracted with methanol, ethanol, or dialysis-lyophilization. Boxes reflect 25%–75% range of CV's observed in three replicate experiments; whiskers reflect the 2%–98% range of CV's observed in three replicate experiments.
Fig. 4.
Fig. 4.
Depletion of albumin and IgG. a, number and identity of peptides and proteins identified in normoalbuminuric or macroalbuminuric urine samples either depleted or non-depleted of albumin and IgG. The numbers in parentheses represent the number of identified peptides or proteins for each sample type. The peptide Venn diagrams display the number of unique peptides with ≥20% confidence that are used in identifying and quantitating the proteins. b, correlation in iTRAQ intensities between normal and proteinuric samples either depleted or left undepleted of albumin/IgG. The values represent the Pearson correlation for normalized iTRAQ values ((iTRAQ value − mean)/S.D.) of all proteins between two samples.
Fig. 5.
Fig. 5.
Pima cases and controls. a, proteomics work flow for urine sample processing. b, unsupervised hierarchical clustering analysis of the scaled iTRAQ values of the 54 identified proteins segregates cases and controls into two separate groups. The urine collection dates and subject genders are listed under sample names. c, number and overlap in identity of peptides and consensus proteins identified in Pima cases and controls. The consensus proteins are those that occur in 75% (three of four) of cases (or controls). The numbers in parentheses represent the number of identified peptides or proteins for each sample type. The peptide Venn diagram displays the number of unique peptides with ≥20% confidence that are used in identifying and quantitating the proteins. d, colorgram depicting the iTRAQ intensities of the 27 proteins whose levels were more than 1.5-fold different (lower or higher) in cases compared with controls and had statistically significant raw p values for differential expression. The columns represent individual samples with case/control status and gender (F, female; M, male) denoted above the column. The rows represent the identified proteins. iTRAQ ratios are shown on a pseudocolor scale (−2 to 2) with red denoting high ratios and green denoting low ratios. SCX, strong cation exchange.

References

    1. Pieper R., Gatlin C. L., McGrath A. M., Makusky A. J., Mondal M., Seonarain M., Field E., Schatz C. R., Estock M. A., Ahmed N., Anderson N. G., Steiner S. (2004) Characterization of the human urinary proteome: a method for high-resolution display of urinary proteins on two-dimensional electrophoresis gels with a yield of nearly 1400 distinct protein spots. Proteomics 4, 1159–1174 - PubMed
    1. Ross P. L., Huang Y. N., Marchese J. N., Williamson B., Parker K., Hattan S., Khainovski N., Pillai S., Dey S., Daniels S., Purkayastha S., Juhasz P., Martin S., Bartlet-Jones M., He F., Jacobson A., Pappin D. J. (2004) Multiplexed protein quantitation in Saccharomyces cerevisiae using amine-reactive isobaric tagging reagents. Mol. Cell. Proteomics 3, 1154–1169 - PubMed
    1. Khan A., Packer N. H. (2006) Simple urinary sample preparation for proteomic analysis. J. Proteome Res. 5, 2824–2838 - PubMed
    1. Thongboonkerd V., Chutipongtanate S., Kanlaya R. (2006) Systematic evaluation of sample preparation methods for gel-based human urinary proteomics: quantity, quality, and variability. J. Proteome Res. 5, 183–191 - PubMed
    1. Zerefos P. G., Vlahou A. (2008) Urine sample preparation and protein profiling by two-dimensional electrophoresis and matrix-assisted laser desorption ionization time of flight mass spectroscopy. Methods Mol. Biol. 428, 141–157 - PubMed

Publication types