. 2010 Aug;299(2):H566-73.
doi: 10.1152/ajpheart.00430.2010. Epub 2010 May 28.

Divergent effects of low-O(2) tension and iloprost on ATP release from erythrocytes of humans with type 2 diabetes: implications for O(2) supply to skeletal muscle

Affiliations

Divergent effects of low-O(2) tension and iloprost on ATP release from erythrocytes of humans with type 2 diabetes: implications for O(2) supply to skeletal muscle

Randy S Sprague et al. Am J Physiol Heart Circ Physiol. 2010 Aug.

Abstract

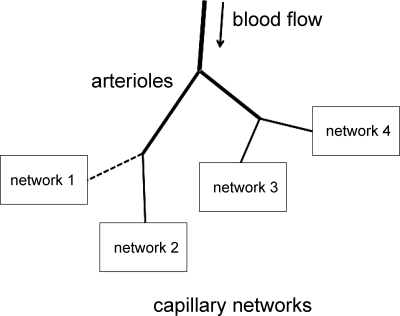
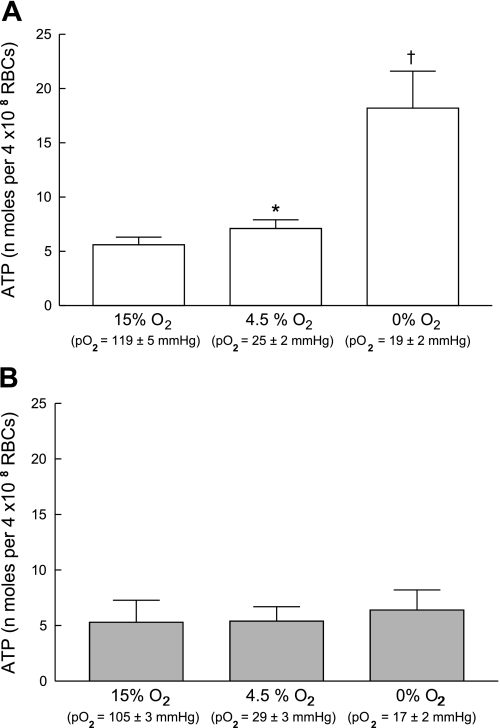
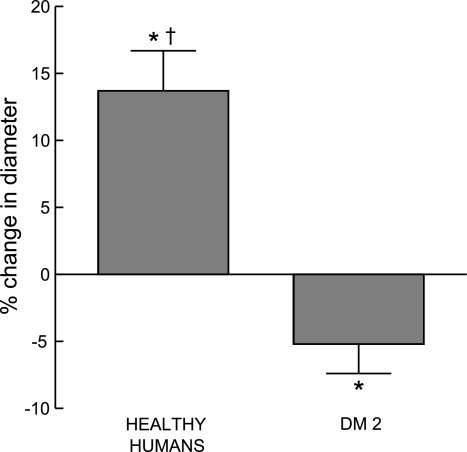
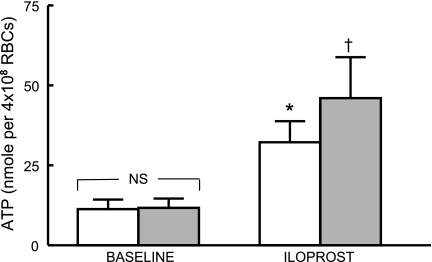
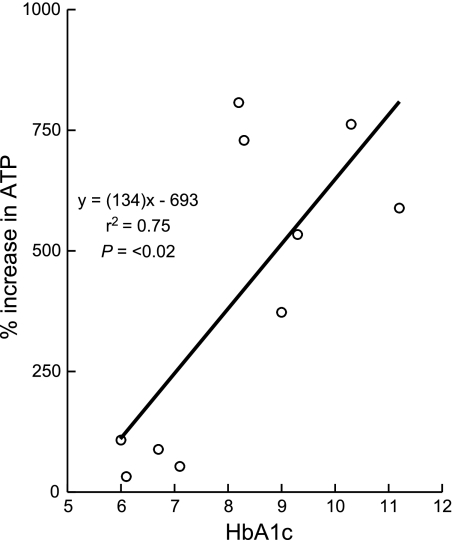
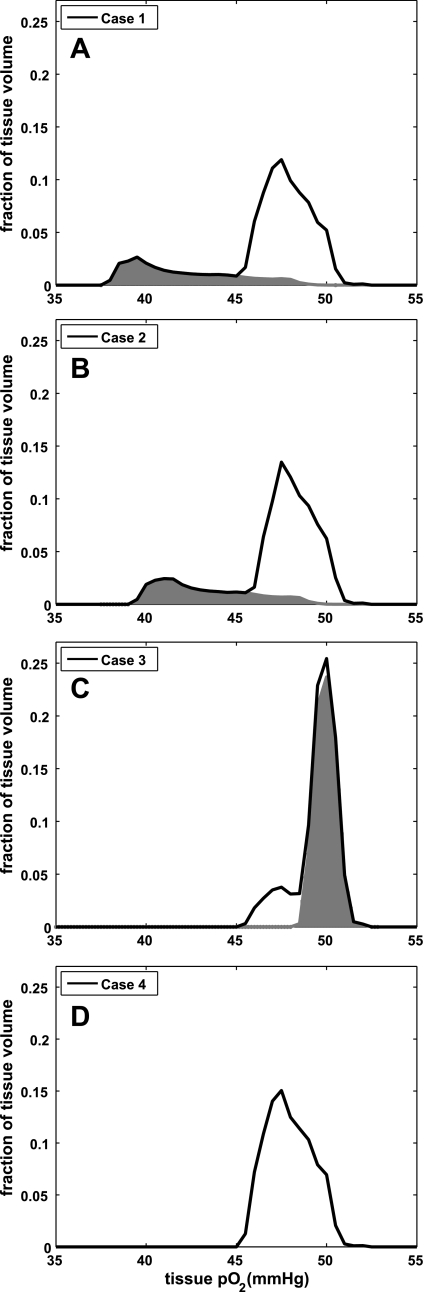
Erythrocytes release both O(2) and a vasodilator, ATP, when exposed to reduced O(2) tension. We investigated the hypothesis that ATP release is impaired in erythrocytes of humans with type 2 diabetes (DM2) and that this defect compromises the ability of these cells to stimulate dilation of resistance vessels. We also determined whether a general vasodilator, the prostacyclin analog iloprost (ILO), stimulates ATP release from healthy human (HH) and DM2 erythrocytes. Finally, we used a computational model to compare the effect on tissue O(2) levels of increases in blood flow directed to areas of increased O(2) demand (erythrocyte ATP release) with nondirected increases in flow (ILO). HH erythrocytes, but not DM2 cells, released increased amounts of ATP when exposed to reduced O(2) tension (Po(2) < 30 mmHg). In addition, isolated hamster skeletal muscle arterioles dilated in response to similar decreases in extraluminal O(2) when perfused with HH erythrocytes, but not when perfused with DM2 erythrocytes. In contrast, both HH and DM2 erythrocytes released ATP in response to ILO. In the case of DM2 erythrocytes, amounts of ATP released correlated inversely with glycemic control. Modeling revealed that a functional regulatory system that directs blood flow to areas of need (low O(2)-induced ATP release) provides appropriate levels of tissue oxygenation and that this level of the matching of O(2) delivery with demand in skeletal muscle cannot be achieved with a general vasodilator. These results suggest that the inability of erythrocytes to release ATP in response to exposure to low-O(2) tension could contribute to the peripheral vascular disease of DM2.


Figures

Fig. 1.
Fig. 1.
Schematic of simulation model. Blood flow to the 4 capillary networks is controlled by upstream arterioles. Nonselective dilation of arterioles will tend to cause uniform increases in flow to all 4 networks, while selective dilation can increase flow to the single undersupplied network only. Dashed line indicates initial undersupply of flow to network 1.
Fig. 2.
Fig. 2.
Effect of exposure to reduced O2 tension on ATP release from erythrocytes of healthy humans (n = 11; A) and humans with type 2 diabetes (DM2; n = 10; B). In a tonometer, isolated erythrocytes (20% hematocrit) were exposed to gas mixtures containing, sequentially, 15% O2, 6% CO2, balance nitrogen, 4.5% O2, 6% CO2, balance nitrogen and 0% O2, 6% CO2, balance nitrogen. ATP release was determined 30 min after exposure to 15% O2 and 10 min after exposure to 4.5 or 0% O2. Values are means ± SE. *Greater than respective 15% O2 value (P < 0.05). †Greater than respective 15% O2 value (P < 0.01) and respective 4.5% O2 value (P < 0.05). Po2, Oxygen tension of the blood in the tonometer.
Fig. 3.
Fig. 3.
Effect of reduced extraluminal O2 tension on dilation of isolated skeletal muscle arterioles perfused with erythrocytes. Isolated arterioles were exposed to either extraluminal normoxia (room air, Po2 = 145 ± 2 mmHg) or reduced O2 tension (Po2 = 18 ± 3 mmHg) and perfused with buffer containing well-oxygenated erythrocytes from either healthy humans (n = 7) or humans with DM2 (n = 6, HbA1c = 8.3 ± 0.8). Values are means ± SE. *Different from value during normoxia. †Different from vessels perfused with erythrocytes of humans with DM2 (P < 0.01).
Fig. 4.
Fig. 4.
ATP release from erythrocytes of healthy humans (n = 13) and humans with DM2 (n = 10) in the absence (open bars) and presence of iloprost (1 μM, filled bars). Values are means ± SE. *Greater than respective baseline value (P < 0.05). †Greater than respective baseline value (P < 0.01).
Fig. 5.
Fig. 5.
Linear regression relationship between hemoglobin A1c (HbA1c) and the percent increase in ATP release produced by incubation of erythrocytes of humans with DM2 with iloprost (n = 10). The baseline ATP level was 11.7 ± 3 nmol/108 erythrocytes.
Fig. 6.
Fig. 6.
Results of oxygen transport simulation of a tissue supplied by 4 discrete capillary networks for 4 different flow distributions among the networks. The solid line in each graph shows the combined tissue Po2 distributions for all 4 networks, while the shaded areas show the contribution from the subset of networks that are under- or oversupplied. A: tissue Po2 distribution is presented for 1 network undersupplied at 25% of normal blood flow (0.25Q, shaded area) and the remaining 3 networks each with normal blood supply (Q) for a total blood flow to the simulated tissue of 3.25Q. BD: results of 3 different ways to adjust the blood supply in an attempt to restore tissue Po2 levels. B and C: represent flows that occur in response to a vasodilator that uniformly increases flow in all arterioles while D represents a regulatory system that directs flow where it is needed. B: total flow to the 4 networks was increased to normal (4Q) with a uniform 23% (100% × 4/3.25) increase in flow to each network. Flow to the undersupplied network (shaded area) increased to 0.31Q. C: flow to the undersupplied network was restored to normal by uniformly increasing flow to all networks by 4-fold such that total flow increased to 13Q, with 3 networks receiving an oversupply (4Q, shaded area). D: represents the case where blood supply to the undersupplied network was increased to normal while blood supply to the other 3 networks was maintained at normal (total flow = 4Q) and hence represents the normal tissue Po2 distribution. Using a vasodilator cannot restore tissue oxygenation to normal since a uniform increase in flow results in some regions either undersupplied (B, shaded area) or oversupplied (C, shaded area).

Similar articles

Cited by

References

    1. Bagi Z, Koller A, Kaley G. Superoxide-NO interaction decreases flow- and agonist-induced dilations of coronary arterioles in type 2 diabetes mellitus. Am J Physiol Heart Circ Physiol 285: H1404–H1410, 2003 - PubMed
    1. Behnke BJ, Kinding CA, McDonough P, Poole DC, Sexton WL. Dynamics of microvascular oxygen pressure during rest-contraction transition in skeletal muscle of diabetic rats. Am J Physiol Heart Circ Physiol 283: H926–H932, 2002 - PubMed
    1. Collins DM, McCullough WT, Ellsworth ML. Conducted vascular responses: communication across the capillary bed. Microvasc Res 56: 43–53, 1998 - PubMed
    1. Collison DJ, Rea R, Donnelly R. Masterclass series in peripheral arterial disease. Vasc Med 9: 307–310, 2004 - PubMed
    1. Dazel HH, Westfall DP. Receptors for adenine nucleotides and nucleosides: subclassification, distribution and molecular characterization. Pharmacol Rev 46: 449–466, 1994 - PubMed

Publication types

MeSH terms