Transcriptomic and phenotypic responses of Listeria monocytogenes strains possessing different growth efficiencies under acidic conditions
- PMID: 20511423
- PMCID: PMC2901733
- DOI: 10.1128/AEM.00315-10
Transcriptomic and phenotypic responses of Listeria monocytogenes strains possessing different growth efficiencies under acidic conditions
Abstract
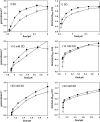
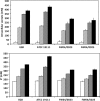
In an experiment delineating aciduric strains, food and clinical Listeria monocytogenes isolates tended to produce the most biomass whereas ovine and avian strains produced comparatively less biomass when exposed to high levels of sodium diacetate (SD) and potassium sorbate. Compared to reference strains that exhibited greater acid sensitivity, representative food isolates with comparatively good growth capacities in the presence of 21 mM SD at pH 5.0 accumulated reduced levels of acetate anion and K(+) ion. The aciduric nature of SD-resistant strains was also reflected by comparatively high tolerance to pH 2.4 (HCl) acid challenges, a property boosted by the presence of SD. Exposure to elevated levels of SD (21 mM SD at pH 5.0) was found to have broad effects on gene expression, as differentiated from effects caused by mildly acidic conditions (pH 5.0). SD-resistant strain FW04/0025 was more responsive to elevated SD, increasing the expression of 222 genes (>2-fold change [P < 0.05]), compared to the more sensitive EGD reference strain, which exhibited increases in expression of 112 genes. Key differences between the strains in relation to SD-enhanced transcripts were notably associated with the cell envelope, oxidative stress management, and intermediary metabolism. SD thus appears to differentially influence growth efficiency and survival of strains, under conditions relevant to acidic foods, that could be due to altered cell wall and metabolic phenotypes.
Figures


Similar articles
-
Potential antimicrobials to control Listeria monocytogenes in vacuum-packaged cold-smoked salmon pâté and fillets.Int J Food Microbiol. 2008 Apr 30;123(3):220-7. doi: 10.1016/j.ijfoodmicro.2008.02.001. Epub 2008 Feb 11. Int J Food Microbiol. 2008. PMID: 18308410
-
Differential gene expression and filamentation of Listeria monocytogenes 08-5923 exposed to sodium lactate and sodium diacetate.Food Microbiol. 2017 May;63:153-158. doi: 10.1016/j.fm.2016.11.009. Epub 2016 Nov 18. Food Microbiol. 2017. PMID: 28040163
-
Inhibition of Listeria monocytogenes by acetate, benzoate and sorbate: weak acid tolerance is not influenced by the glutamate decarboxylase system.Lett Appl Microbiol. 2009 Aug;49(2):179-85. doi: 10.1111/j.1472-765X.2009.02634.x. Epub 2009 Apr 29. Lett Appl Microbiol. 2009. PMID: 19422474
-
Global transcriptomic response of Listeria monocytogenes during growth on cantaloupe slices.Food Microbiol. 2019 Feb;77:192-201. doi: 10.1016/j.fm.2018.09.012. Epub 2018 Sep 15. Food Microbiol. 2019. PMID: 30297050
-
Adaptive acid tolerance response of Listeria monocytogenes strains under planktonic and immobilized growth conditions.Int J Food Microbiol. 2012 Oct 1;159(2):160-6. doi: 10.1016/j.ijfoodmicro.2012.07.027. Epub 2012 Aug 3. Int J Food Microbiol. 2012. PMID: 22980026
Cited by
-
Global Transcriptional Response of Three Highly Acid-Tolerant Field Strains of Listeria monocytogenes to HCl Stress.Microorganisms. 2019 Oct 16;7(10):455. doi: 10.3390/microorganisms7100455. Microorganisms. 2019. PMID: 31623206 Free PMC article.
-
Acid stress signals are integrated into the σB-dependent general stress response pathway via the stressosome in the food-borne pathogen Listeria monocytogenes.PLoS Pathog. 2022 Mar 11;18(3):e1010213. doi: 10.1371/journal.ppat.1010213. eCollection 2022 Mar. PLoS Pathog. 2022. PMID: 35275969 Free PMC article.
-
The transcriptional response of Listeria monocytogenes during adaptation to growth on lactate and diacetate includes synergistic changes that increase fermentative acetoin production.Appl Environ Microbiol. 2011 Aug;77(15):5294-306. doi: 10.1128/AEM.02976-10. Epub 2011 Jun 10. Appl Environ Microbiol. 2011. PMID: 21666015 Free PMC article.
-
Adaptive Response of Listeria monocytogenes to the Stress Factors in the Food Processing Environment.Front Microbiol. 2021 Aug 19;12:710085. doi: 10.3389/fmicb.2021.710085. eCollection 2021. Front Microbiol. 2021. PMID: 34489900 Free PMC article. Review.
-
Metabolic reprogramming in the food-borne pathogen Listeria monocytogenes as a critical defence against acid stress.FEMS Microbiol Lett. 2024 Jan 9;371:fnae060. doi: 10.1093/femsle/fnae060. FEMS Microbiol Lett. 2024. PMID: 39118365 Free PMC article. Review.
References
-
- Abachin, E., C. Poyart, E. Pellegrini, E. Milohanic, F. Fiedler, P. Berche, and P. Trieu-Cuot. 2002. Formation of D-alanyl-lipoteichoic acid is required for adhesion and virulence of Listeria monocytogenes. Mol. Microbiol. 43:1-14. - PubMed
-
- Alonso-Hernando, A., C. Alonso-Calleja, and R. Capita. 2009. Comparative analysis of acid resistance in Listeria monocytogenes and Salmonella enterica strains before and after exposure to poultry decontaminants. Role of the glutamate decarboxylase (GAD) system. Food Microbiol. 26:905-909. - PubMed
-
- Ballal, A., B. Basu, and S. K. Apte. 2007. The Kdp-ATPase system and its regulation. J. Biosci. 32:559-568. - PubMed
-
- Baranyi, J., and T. A. Roberts. 1994. A dynamic approach to predicting bacterial growth in food. Int. J. Food Microbiol. 23:277-294. - PubMed
Publication types
MeSH terms
Substances
LinkOut - more resources
Full Text Sources
Molecular Biology Databases

