Review
. 2010 Jun;85(6):572-93.
doi: 10.4065/mcp.2010.0046.

Pericardial disease: diagnosis and management

Affiliations
Review

Pericardial disease: diagnosis and management

Masud H Khandaker et al. Mayo Clin Proc. 2010 Jun.

Abstract

Pericardial diseases can present clinically as acute pericarditis, pericardial effusion, cardiac tamponade, and constrictive pericarditis. Patients can subsequently develop chronic or recurrent pericarditis. Structural abnormalities including congenitally absent pericardium and pericardial cysts are usually asymptomatic and are uncommon. Clinicians are often faced with several diagnostic and management questions relating to the various pericardial syndromes: What are the diagnostic criteria for the vast array of pericardial diseases? Which diagnostic tools should be used? Who requires hospitalization and who can be treated as an outpatient? Which medical management strategies have the best evidence base? When should corticosteroids be used? When should surgical pericardiectomy be considered? To identify relevant literature, we searched PubMed and MEDLINE using the keywords diagnosis, treatment, management, acute pericarditis, relapsing or recurrent pericarditis, pericardial effusion, cardiac tamponade, constrictive pericarditis, and restrictive cardiomyopathy. Studies were selected on the basis of clinical relevance and the impact on clinical practice. This review represents the currently available evidence and the experiences from the pericardial clinic at our institution to help guide the clinician in answering difficult diagnostic and management questions on pericardial diseases.


Figures
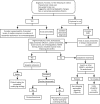
FIGURE 1.
FIGURE 1.
Overview of the diagnosis and management of acute pericarditis. CMR = cardiac magnetic resonance imaging; NSAID = nonsteroidal anti-inflammatory drug. *Corticosteroids should not be routinely used initially unless there is a rheumatologic etiology or NSAIDs and colchicine are contraindicated.
FIGURE 2.
FIGURE 2.
Electrocardiographic abnormalities in acute pericarditis. Diffuse up-sloping ST-segment elevation is seen in leads I, II, aVF, and V1 to V6. The PR segment is elevated in the aVR lead (arrows) and subtly depressed in leads I, II, aVF, and V2 to V6 (arrowheads). Reciprocal ST-segment depression is seen in the aVR lead.
FIGURE 3.
FIGURE 3.
Two-dimensional transthoracic echocardiogram showing the parasternal long-axis view in a patient diagnosed as having acute pericarditis. A moderate-sized pericardial effusion (PE) is present posteriorly. LA = left atrium; LV = left ventricle; RV = right ventricle.
FIGURE 4.
FIGURE 4.
Short-axis cardiac magnetic resonance imaging with delayed gadolinium enhancement in a patient with acute pericarditis. The brightly enhanced pericardium (arrowheads) is suggestive of inflammation in a patient with acute pericarditis.
FIGURE 5.
FIGURE 5.
Gross anatomic features of relapsing pericarditis. Left, Anterior view of fibrinous pericardium in a patient with recurrent pericarditis. Right, Thickened fibrinous pericardium after surgical pericardiectomy. Photograph courtesy of William D. Edwards, MD.
FIGURE 6.
FIGURE 6.
Overview of the management of relapsing pericarditis. CMR = cardiac magnetic resonance imaging; CRP = C-reactive protein; CT = computed tomography; ESR = erythrocyte sedimentation rate; NSAID = nonsteroidal anti-inflammatory drug; WBC = white blood cell count. *Corticosteroids should not be routinely used initially unless there is a rheumatologic etiology or NSAIDs and colchicine are contraindicated.
FIGURE 7.
FIGURE 7.
Cardiac computed tomography (CT) and cardiac magnetic resonance imaging in chronic relapsing pericarditis. Left, Cardiac CT showing thickened areas of pericardium (arrows) and areas of loculated pericardial effusion (*). Pericardium of normal thickness (arrowheads) is also present in this patient with chronic recurrent pericarditis. Right, Cardiac magnetic resonance imaging from the same patient shows a delayed gadolinium enhancement short-axis image. The brightly enhanced pericardium (arrows) is suggestive of inflammation. A loculated pericardial effusion (*) is also shown.
FIGURE 8.
FIGURE 8.
Overview of the diagnosis and management of cardiac tamponade. E = early diastolic filling; ECG = electrocardiography; IVC = inferior vena cava; IVRT = isovolumic relaxation time; JVP = jugular venous pressure; LA = left atrium; RA = right atrium; RV = right ventricle.
FIGURE 9.
FIGURE 9.
Two-dimensional echocardiographic features of cardiac tamponade. A, Still-frame image of an apical 4-chamber view showing late diastolic collapse of the right atrium (RA, arrow). Persistence of RA collapse for more than one-third of the cardiac cycle is highly sensitive and specific for tamponade. B, Early diastolic collapse (arrow) of the right ventricle (RV) is specific for tamponade. C, Parasternal long-axis views showing the swinging motion of the heart within the pericardial cavity of a large pericardial effusion; the swinging motion is responsible for the electrocardiographic manifestation termed electrical alternans. LV = left ventricle; PE = pericardial effusion; VS = ventricular septum. Adapted from reference .
FIGURE 10.
FIGURE 10.
Doppler echocardiographic features in cardiac tamponade. A, Schematic diagram of simultaneous electrocardiographic (ECG), respirometer (Resp), mitral valve (MV) Doppler, and pressure (Pres) changes in intrapericardial (IP) and pulmonary capillary wedge (PW) pressure. Intrapericardial pressure does not change much with respiration, whereas PW pressure decreases with inspiration (INSP), which results in respiratory variation in left ventricular filling and MV inflow Doppler velocity recording. B, Doppler mitral inflow velocities with respiratory variation; mitral E velocity is higher with expiration (EXP) than with INSP. C, Pulsed-wave Doppler recording of the hepatic vein velocities; forward flow (arrows) decreases with EXP and diastolic flow reversal increases (*) with EXP. Adapted from reference .
FIGURE 11.
FIGURE 11.
Hemodynamics of acute cardiac tamponade by cardiac catheterization. Left, In the very early stages of cardiac tamponade, the right atrial (RA) pressure is mildly elevated, with a more pronounced a wave and a diminution of rapid y descent (arrow) suggesting left ventricular filling abnormalities. The aortic pressure (Ao) has not yet decreased because of increased vasoconstriction, and the pulse pressure remains normal. Right, As tamponade progresses, the Ao and pulse pressure significantly decrease. The further drop in Ao during inspiration (Insp) compared with expiration (Exp) is evidence of pulsus paradoxus. a = a wave; x = x descent; v = v wave.
FIGURE 12.
FIGURE 12.
Gross pathological features of constrictive pericarditis and restrictive cardiomyopathy. Left, Heart specimen of a patient who died with constrictive pericarditis. The pericardium is thickened and calcified; fibrosis and adhesion of the pericardial layers can be observed. Diastolic filling of the right and left ventricles was markedly reduced. Right, Heart specimen of a patient who died with restrictive cardiomyopathy. Diastolic filling is limited by an abnormal myocardium, resulting in biatrial enlargement. The ventricles are not dilated in restrictive cardiomyopathy. Photograph courtesy of William D. Edwards, MD.
FIGURE 13.
FIGURE 13.
Overview of the diagnosis and management of constrictive pericarditis. ACE = angiotensin-converting enzyme; ECG = electrocardiography; IVC = inferior vena cava; JVP = jugular venous pressure; LV = left ventricle; NSAID = nonsteroidal anti-inflammatory drug; RV = right ventricle.
FIGURE 14.
FIGURE 14.
Chest radiograph, transesophageal echocardiogram (TEE), and cardiac computed tomogram typical of constrictive pericarditis. A, Pericardial calcification (arrows) on chest radiography is best seen from the lateral view over the right ventricle (RV) and across the diaphragmatic surface of the heart. Pericardial calcification reflects chronicity of constrictive pericarditis and is associated with a higher surgical mortality. B, Thickness of the pericardium is often difficult to determine by transthoracic echocardiography, but TEE is usually reliable in measuring the pericardial thickness (arrows). C, Increased pericardial thickness (arrows) can be visualized on computed tomogram of the same patient. LA = left atrium; LV = left ventricle; RA = right atrium. Adapted from reference .
FIGURE 15.
FIGURE 15.
Schematic diagram of Doppler echocardiographic features in constrictive pericarditis vs restrictive cardiomyopathy. Schematic illustration of Doppler velocities from mitral inflow (MV), mitral annulus velocity, and hepatic vein (HV). Electrocardiographic (ECG) and respirometer (Resp) recordings indicating inspiration (i) and expiration (e) are also shown. A = atrial filling; D = diastolic flow; DR = diastolic flow reversal; DT = deceleration time; E = early diastolic filling; S = systolic flow; SR = systolic flow reversal. Stippled areas under the curve represent flow reversal. From reference .
FIGURE 16.
FIGURE 16.
Ventricular interdependence and respiratory variation in ventricular filling in constrictive pericarditis and restrictive cardiomyopathy. Ventricular interdependence is observed in simultaneous recordings of left ventricular (LV) and right ventricular (RV) pressures. Left, In constrictive pericarditis, inspiration (Insp) induces less filling of the LV, and the area of the LV pressure curve decreases (yellow shaded area) as compared with expiration (Exp). The opposite changes occur in the RV so that area of the RV pressure curve increases with Insp (orange shaded area). Ejection time also varies with respiration in opposite directions in LV and RV. This discordant pressure change between the LV and RV occurs in constrictive pericarditis. Right, In restrictive cardiomyopathy, the changes in LV and RV systolic pressures with respiration are concordant. During Insp, the area of the RV pressure curve decreases (orange shaded area) as compared with Exp. The area of the LV pressure curve (yellow shaded area) is unchanged during Insp as compared with Exp. Note that both patients have early rapid filling and elevation and end-equalization of the LV and RV pressures at end Exp.

Comment in

Similar articles

Cited by

References

    1. Maisch B, Seferovic PM, Ristic AD, et al. Guidelines on the diagnosis and management of pericardial diseases executive summary: The task force on the diagnosis and management of pericardial diseases of the European Society of Cardiology. Eur Heart J. 2004;25(7):587-610 - PubMed
    1. Spodick DH. Acute cardiac tamponade. N Engl J Med. 2003;349(7):684-690 - PubMed
    1. Zayas R, Anguita M, Torres F, et al. Incidence of specific etiology and role of methods for specific etiologic diagnosis of primary acute pericarditis. Am J Cardiol. 1995;75(5):378-382 - PubMed
    1. Permanyer-Miralda G, Sagrista-Sauleda J, Soler-Soler J. Primary acute pericardial disease: a prospective series of 231 consecutive patients. Am J Cardiol. 1985;56(10):623-630 - PubMed
    1. Lange RA, Hillis LD. Clinical practice: acute pericarditis [published correction appears in N Engl J Med. 2005;352(11):1163] N Engl J Med. 2004;351(21):2195-2202 - PubMed

MeSH terms