. 2010 Aug;69(8):1502-10.
doi: 10.1136/ard.2009.119966. Epub 2010 May 28.

Superoxide dismutase downregulation in osteoarthritis progression and end-stage disease

Affiliations

Superoxide dismutase downregulation in osteoarthritis progression and end-stage disease

Jenny L Scott et al. Ann Rheum Dis. 2010 Aug.

Erratum in

  • Ann Rheum Dis. 2011 Feb;70(2):397. Talyor, Robert W [corrected to Taylor, Robert W]

Abstract

Background: Oxidative stress is proposed as an important factor in osteoarthritis (OA).

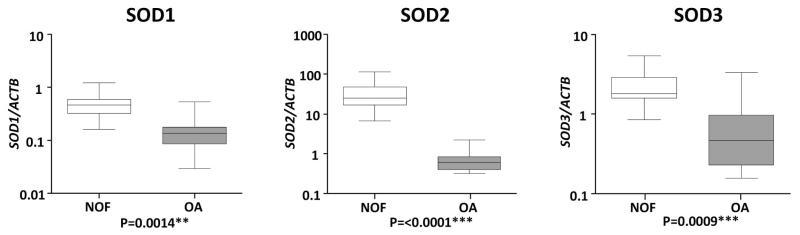
Objective: To investigate the expression of the three superoxide dismutase (SOD) antioxidant enzymes in OA.

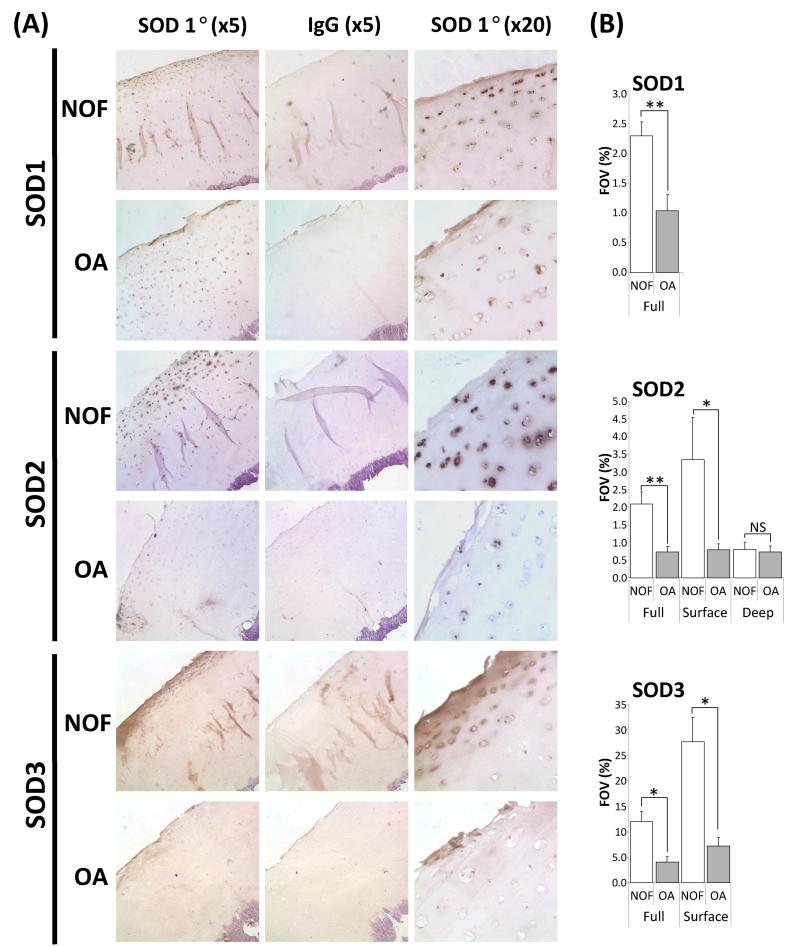
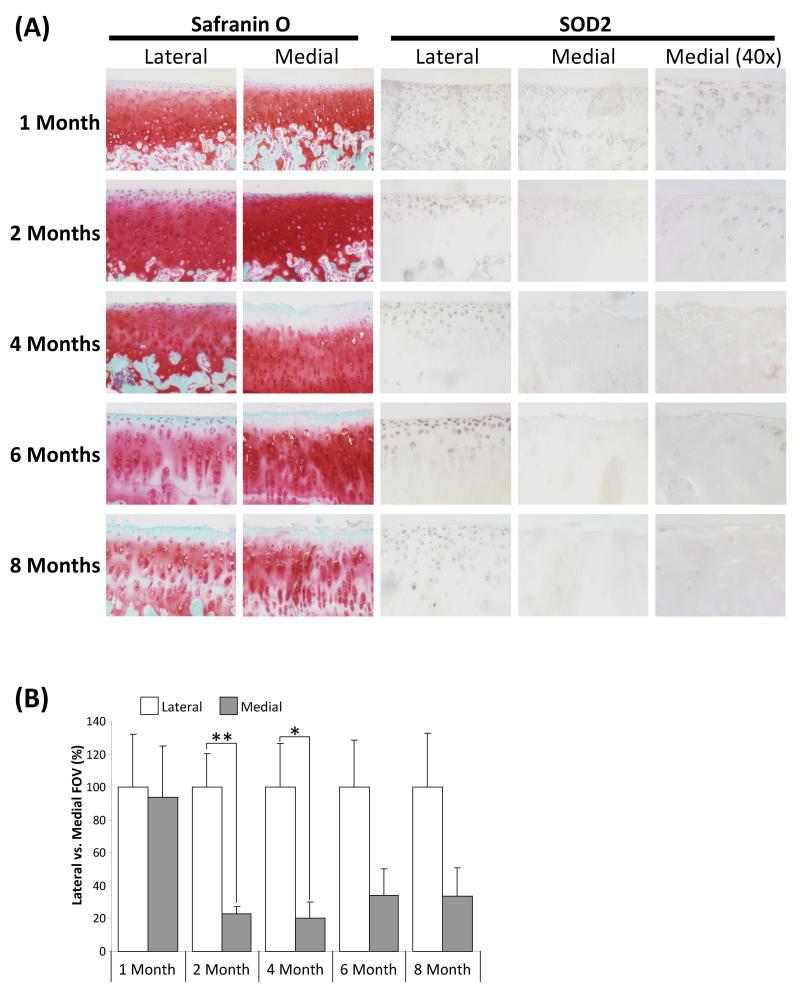
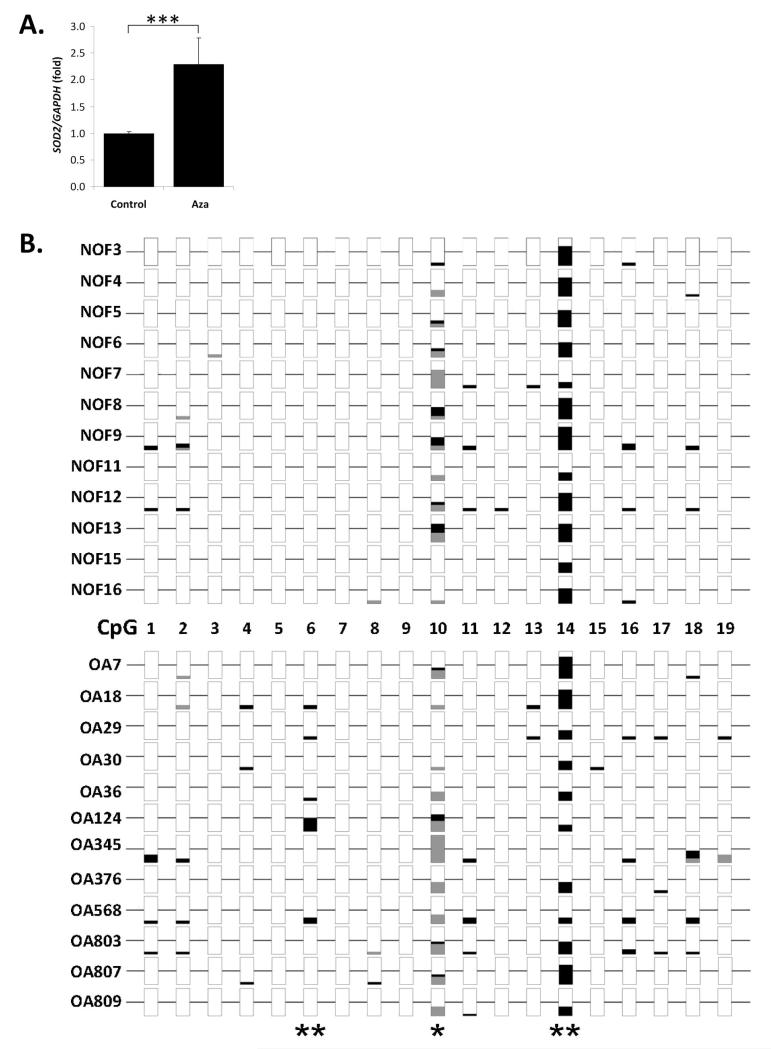
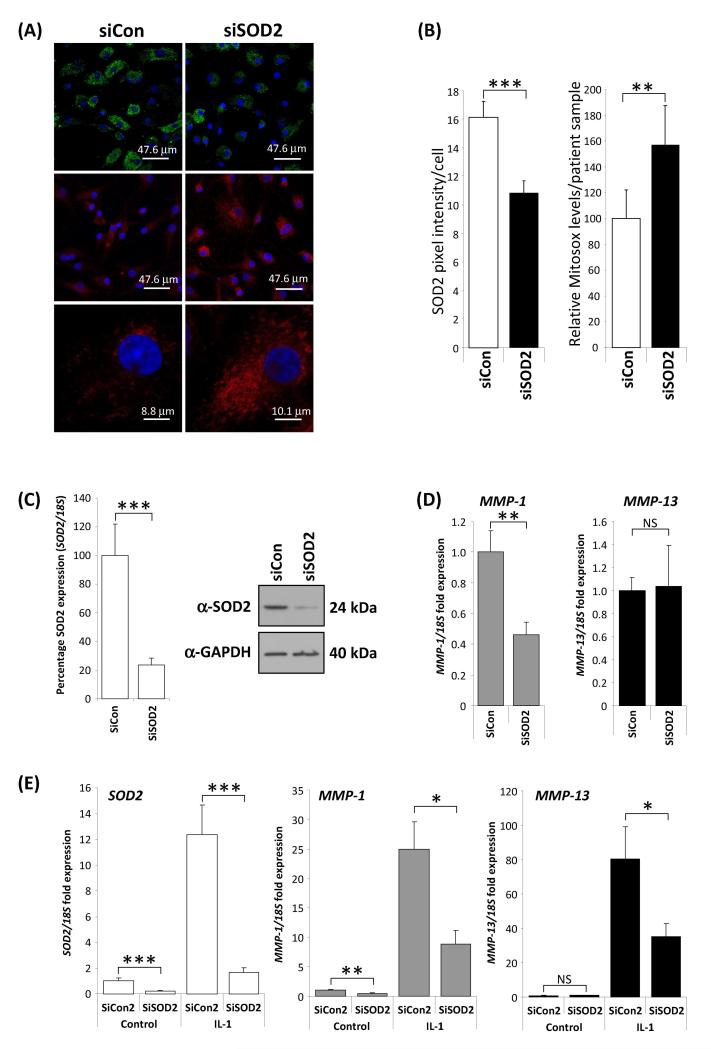
Methods: SOD expression was determined by real-time PCR and immunohistochemistry using human femoral head cartilage. SOD2 expression in Dunkin-Hartley guinea pig knee articular cartilage was determined by immunohistochemistry. The DNA methylation status of the SOD2 promoter was determined using bisulphite sequencing. RNA interference was used to determine the consequence of SOD2 depletion on the levels of reactive oxygen species (ROS) using MitoSOX and collagenases, matrix metalloproteinase 1 (MMP-1) and MMP-13, gene expression.

Results: All three SOD were abundantly expressed in human cartilage but were markedly downregulated in end-stage OA cartilage, especially SOD2. In the Dunkin-Hartley guinea pig spontaneous OA model, SOD2 expression was decreased in the medial tibial condyle cartilage before, and after, the development of OA-like lesions. The SOD2 promoter had significant DNA methylation alterations in OA cartilage. Depletion of SOD2 in chondrocytes increased ROS but decreased collagenase expression.

Conclusion: This is the first comprehensive expression profile of all SOD genes in cartilage and, importantly, using an animal model, it has been shown that a reduction in SOD2 is associated with the earliest stages of OA. A decrease in SOD2 was found to be associated with an increase in ROS but a reduction of collagenase gene expression, demonstrating the complexities of ROS function.


Figures

Figure 1
Figure 1
Comparison of superoxide dismutase (SOD) gene expression between cartilage from neck of femur (NOF) and osteoarthritis (OA) patients. SOD family gene expression was determined by real-time reverse transcriptase polymerase chain reaction (RT-PCR) from cartilage RNA isolated from 12 NOF (open) and 12 OA patients (shaded). Gene expression data are presented as a ratio of SOD gene levels to that of the housekeeping gene Actin B (ACTB) using the calculation 2−ΔCT. Lines within the boxes represent the median, the boxes represent the 25th and 75th percentiles, and the lines outside the boxes correspond to the minimum and maximum values. Presented P values were calculated using the Mann-Whitney U-test, where * represents P<0.05, ** P<0.01 and *** P<0.001.
Figure 2
Figure 2
Immunohistochemical analysis of SOD expression in representative specimens of human articular cartilage from NOF and OA patients. A, Sections were subjected to immunohistochemistry using the labelled anti-SOD or normal rabbit IgG (negative control) and counterstained with haematoxylin. Full-depth sections are shown at × 5 magnification and for clarity the articular surface is shown at × 20. Images are representative of sections from 5 NOF and 5 OA patients. B, immunohistochemical images, of fixed exposure, from 5 NOF and 5 OA patients were quantified using the ImageJ software. For each image the percentage staining in each field of view (FOV) was calculated and the mean with standard error of the mean (SEM) NOF and OA FOV presented. Percentage FOV was calculated for full depth sections or dividing the section into two quadrants ‘deep’ and ‘surface’. P values were calculated using Student’s t-test, where * represents P<0.05 and ** P<0.01.
Figure 3
Figure 3
Immunohistochemical analysis of SOD2 expression in representative specimens of Dunkin-Hartley guinea pig articular cartilage. A, Cartilage sections are representative of 5 animals at each time point (1 to 12 months of age). Sections were either stained with safranin ‘O’ as a marker of proteoglycan or subjected to immunohistochemistry using the labelled anti-SOD2 or normal rabbit IgG (negative control – data not shown). Lateral and medial tibial plateaus are as indicated. Images shown are at × 10 magnification, unless indicated otherwise. B, Immunohistochemical images of lateral and medial tibial plateaus, of fixed exposure, from 5 animals were quantified using the ImageJ software. For each image the percentage staining in each field of view (FOV) was calculated. For each age group the staining in the lateral plateau is arbitrarily 100% + SEM. P values were calculated using Student’s t-test, where * represents P<0.05 and ** P<0.01.
Figure 4
Figure 4
Analysis of the regulation of SOD2 in human articular chondrocytes (HAC) by DNA methylation. A, Primary HAC were treated with the DNA demethylating agent 5-aza-2′deoxycytidine (AZA) for 35 days (2 passages) as described and SOD2 expression measured by real-time RT-PCR and normalised to GAPDH expression levels. Data is presented fold over control and error bars represent SEM. Data is combined from four HAC populations treated in duplicate. Statistical significance was calculated using the Mann-Whitney U-test, where *** represents P<0.001. B, DNA methylation analysis of the SOD2 promoter in cartilage genomic DNA from neck of femur (NOF) and osteoarthritis (OA) patients. Genomic DNA from cartilage of 12 NOF and 12 OA patients was analysed to determine the methylation status of the SOD2 promoter region spanning 19 potential CpG dinucleotides. An average of 9.6 non-clonal DNA sequences per patient sample were analysed and the methylation percentage for each is plotted. Methylation CpG sequences are represented by black bars, open are non-methylated and the bar is grey when the CpG sequence was not detected, generally due to a SNP at that locus (e.g. CpG10). Fisher’s exact test was used for statistical analysis, where * represents P<0.05 and ** P<0.01.
Figure 5
Figure 5
Functional consequences of SOD2 depletion. A and B, SOD2 depletion (green) by RNAi led to a significant increase in MitoSOX™ Red mitochondrial staining as determined by confocal microscropy. Data are taken from four patient chondrocyte preparations. Images were quantified using ImageJ software on a per cell basis from random field images. P values were calculated using a Student’s t-test, where ** represents P<0.01 and *** P<0.001 C-E, Depletion of SOD2 leads to reduction in collagenase gene expression. C, transfection of primary human articular chondrocytes (HAC) from OA patients with siRNA to SOD2 (siSOD2) for 48 hours under basal conditions (24 hour serum free) compared to transfection with an equivalent amount (100nM) of a non-targeting control siRNA (siCon) resulted in a highly significant approximately 80% reduction in SOD2 RNA level as determined by realtime RT-PCR. Concomitantly a substantial reduction in SOD2 protein expression was measured by immunoblotting (an anti-GAPDH antibody was used as a protein loading control). D, MMP-1 and MMP-13 basal expression levels were measured as described above. SOD2 RNAi resulted in a significant reduction in MMP-1 but no change in the levels of MMP-13. E, interleukin-1 (IL-1, 0.05 ng/ml) stimulation for 24 hours induced the expression of SOD2, MMP-1 and MMP-13, however the induced-expression of all three genes was significantly reduced when SOD2 was depleted by RNAi (siSOD2). Throughout RNA expression levels were normalised to the 18S gene and data plotted as fold over control levels. Data presented are from a single experiment (n=8) using cells from one donor. The experiment was performed three times using different patient cell populations. P values were calculated using the Mann-Whitney U-test, where * represents P<0.05, ** P<0.01 and *** P<0.001. Error bars shown are SEM.

Similar articles

Cited by

References

    1. Martin JA, Buckwalter JA. Aging, articular cartilage chondrocyte senescence and osteoarthritis. Biogerontology. 2002;3(5):257–64. - PubMed
    1. Dudhia J. Aggrecan, aging and assembly in articular cartilage. Cell Mol Life Sci. 2005 Oct;62(19-20):2241–56. - PMC - PubMed
    1. Carrington JL. Aging bone and cartilage: cross-cutting issues. Biochem Biophys Res Commun. 2005 Mar 18;328(3):700–8. - PubMed
    1. Henrotin Y, Kurz B, Aigner T. Oxygen and reactive oxygen species in cartilage degradation: friends or foes? Osteoarthritis Cartilage. 2005 Aug;13(8):643–54. - PubMed
    1. Plumb MS, Aspden RM. The response of elderly human articular cartilage to mechanical stimuli in vitro. Osteoarthritis Cartilage. 2005 Dec;13(12):1084–91. - PubMed

Publication types

MeSH terms

Substances