. 2010 Nov;95(11):1814-22.
doi: 10.3324/haematol.2010.023879. Epub 2010 May 29.

Polarization dictates iron handling by inflammatory and alternatively activated macrophages

Affiliations

Polarization dictates iron handling by inflammatory and alternatively activated macrophages

Gianfranca Corna et al. Haematologica. 2010 Nov.

Abstract

Background: Macrophages play a key role in iron homeostasis. In peripheral tissues, they are known to polarize into classically activated (or M1) macrophages and alternatively activated (or M2) macrophages. Little is known on whether the polarization program influences the ability of macrophages to store or recycle iron and the molecular machinery involved in the processes.

Design and methods: Inflammatory/M1 and alternatively activated/M2 macrophages were propagated in vitro from mouse bone-marrow precursors and polarized in the presence of recombinant interferon-γ or interleukin-4. We characterized and compared their ability to handle radioactive iron, the characteristics of the intracellular iron pools and the expression of molecules involved in internalization, storage and export of the metal. Moreover we verified the influence of iron on the relative ability of polarized macrophages to activate antigen-specific T cells.

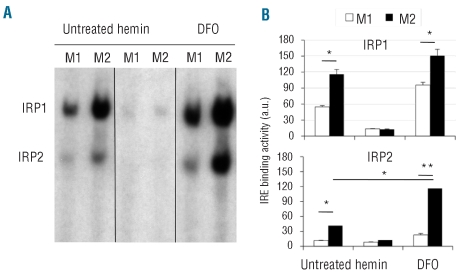
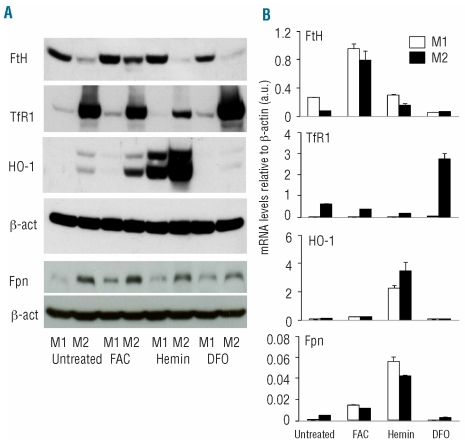
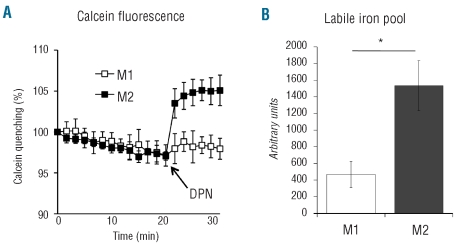
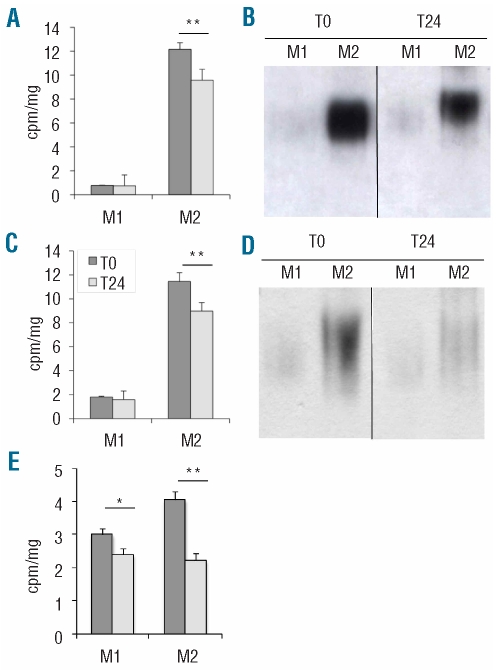
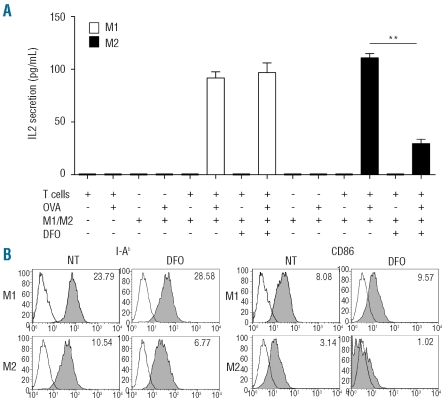
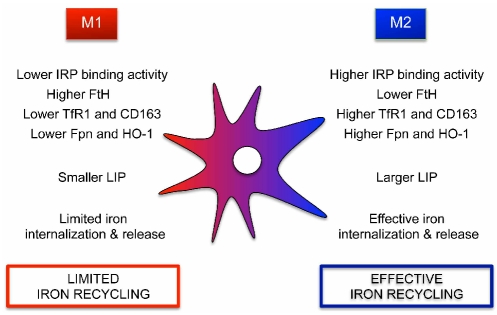
Results: M1 macrophages have low iron regulatory protein 1 and 2 binding activity, express high levels of ferritin H, low levels of transferrin receptor 1 and internalize--albeit with low efficiency -iron only when its extracellular concentration is high. In contrast, M2 macrophages have high iron regulatory protein binding activity, express low levels of ferritin H and high levels of transferrin receptor 1. M2 macrophages have a larger intracellular labile iron pool, effectively take up and spontaneously release iron at low concentrations and have limited storage ability. Iron export correlates with the expression of ferroportin, which is higher in M2 macrophages. M1 and M2 cells activate antigen-specific, MHC class II-restricted T cells. In the absence of the metal, only M1 macrophages are effective.

Conclusions: Cytokines that drive macrophage polarization ultimately control iron handling, leading to the differentiation of macrophages into a subset which has a relatively sealed intracellular iron content (M1) or into a subset endowed with the ability to recycle the metal (M2).


Figures

Figure 1.
Figure 1.
RNA binding activity of IRP1 and IRP2. (A) Cytoplasmic extracts of M1 and M2 macrophages, treated or not with hemin (100 μM) or DFO (150 μM), were incubated with an excess of a 32P-labeled iron responsive element probe. RNA-protein complexes were resolved on non-denaturing polyacrylamide gels and revealed by autoradiography. The result shown is representative of three independent experiments. (B) Radioactivity associated with RNA protein complexes was quantified and plotted (arbitrary units, a.u., y axis). * P<0.05; ** P<0.001, significantly different from control.
Figure 2.
Figure 2.
Expression of proteins involved in iron metabolism in M1 and M2 macrophages. (A) Western blot analysis of the expression of FtH, TfR1, HO-1 and Fpn in M1 and M2 macrophages, either untreated or incubated over night in the presence of FAC (150 μM), hemin (100 μM) and DFO (150 μM). Results shown are representative of three independent experiments. (B) qPCR analysis of FtH, TfR1, HO-1 and Fpn in M1 and M2 macrophages, either untreated or incubated overnight in the presence of FAC (150 μM), hemin (100 μM) or DFO (150μM).
Figure 3.
Figure 3.
Labile iron pool in M1 and M2 macrophages. (A) Representative graph illustrating calcein fluorescence modulation in M1 and M2 macrophages before and after deferiprone addition. Data are presented as averages of four independent determinations for each experimental point. (B) Quantification of LIP. Data are presented as averages of three independent experiments, each done as in (A). Error bars indicate standard deviations. DPN: deferiprone. * P<1.5x10⁻⁵.
Figure 4.
Figure 4.
Incorporation and release of 55Fe by M1 and M2 macrophages. M1 and M2 macrophages were incubated overnight with [55Fe] ferric iron citrate (2.5 μM iron) in the presence of ascorbic acid (A) and (B) or with 2.5 μM transferrin bound 55Fe (C and D), or with [55Fe] ferric iron citrate in the presence of ascorbic acid (150 μM iron, E), washed and lysed either immediately or after a 24 h chase. (A, C and E) Cell-associated radioactivity (cpm/mg of protein extract, y axis) was evaluated. Results represent the mean ± SD of quadruplicate samples. **P<0.01, significantly different from control. (B and D) Cell extracts were obtained at the times indicated and were resolved on a native polyacrylamide gel. Radioactive iron incorporation into Ft was evaluated by autoradiography.
Figure 5.
Figure 5.
Effects of iron availability on antigen presentation by M1 and M2 cells. (A) M1 (open bars) and M2 (filled bars) macrophages were used to activate MHC class II-restricted T hybridoma cells specific for the nominal antigen ovalbumin (OVA). When indicated, the iron chelator DFO was added. T-cell activation was assessed by IL2 secretion (pg/mL, y axis, see Design and Methods). T-cell activation, as expected, was detectable only when antigen-presenting cells (M1/M2), T cells and the antigen (OVA) were present. DFO did not influence T-cell activation by M1 macrophages, but significantly inhibited T-cell activation by M2 macrophages. (B): M1 and M2 macrophages, cultured in the presence or absence of DFO, were analyzed by flow cytometry after staining with antibodies directed against MHC class II molecules (I-Ab) or against the CD86 co-stimulatory molecule. Filled histograms represent the binding of specific antibodies, whereas open histograms represent the fluorescence background obtained in the presence of isotype-matched control antibodies. Numbers indicate the relative fluorescence intensity (RFI) values, calculated dividing the mean fluorescence intensity obtained in the experimental sample by the one obtained with the relevant control. The results shown are representative of three independent experiments. ** P<0.01, significantly different from control.
Figure 6.
Figure 6.
Main characteristics of iron handling by M1 and M2 macrophages. LIP, labile iron pool.

Comment in

References

    1. Mantovani A, Sica A, Locati M. New vistas on macrophage differentiation and activation. Eur J Immunol. 2007;37(1):14–6. - PubMed
    1. Paradkar PN, De Domenico I, Durchfort N, Zohn I, Kaplan J, Ward DM. Iron depletion limits intracellular bacterial growth in macrophages. Blood. 2008;112(3):866–74. - PMC - PubMed
    1. Martinez FO, Helming L, Gordon S. Alternative activation of macrophages: an immunologic functional perspective. Annu Rev Immunol. 2009;27:451–83. - PubMed
    1. De Domenico I, McVey Ward D, Kaplan J. Regulation of iron acquisition and storage: consequences for iron-linked disorders. Nat Rev Mol Cell Biol. 2008;9(1):72–81. - PubMed
    1. Theurl I, Aigner E, Theurl M, Nairz M, Seifert M, Schroll A, et al. Regulation of iron homeostasis in anemia of chronic disease and iron deficiency anemia: diagnostic and therapeutic implications. Blood. 2009;113(21):5277–86. - PubMed

Publication types

MeSH terms