. 2010 Jun;16(6):701-7.
doi: 10.1038/nm.2159. Epub 2010 May 30.

Basophils and the T helper 2 environment can promote the development of lupus nephritis

Affiliations

Basophils and the T helper 2 environment can promote the development of lupus nephritis

Nicolas Charles et al. Nat Med. 2010 Jun.

Abstract

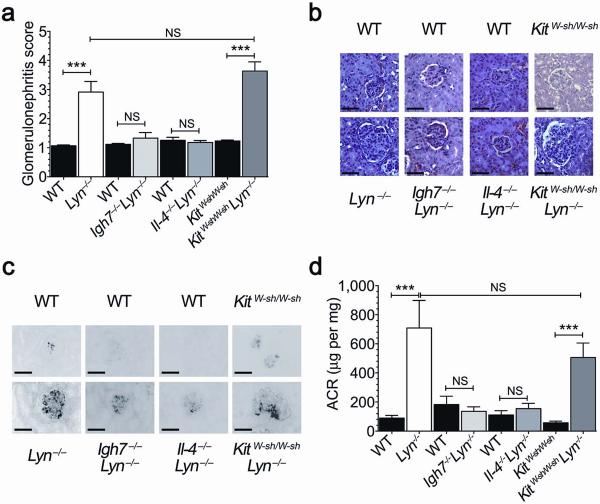
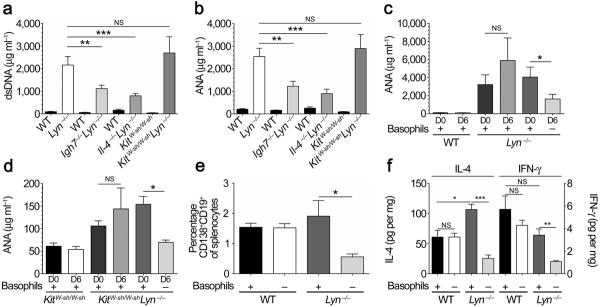
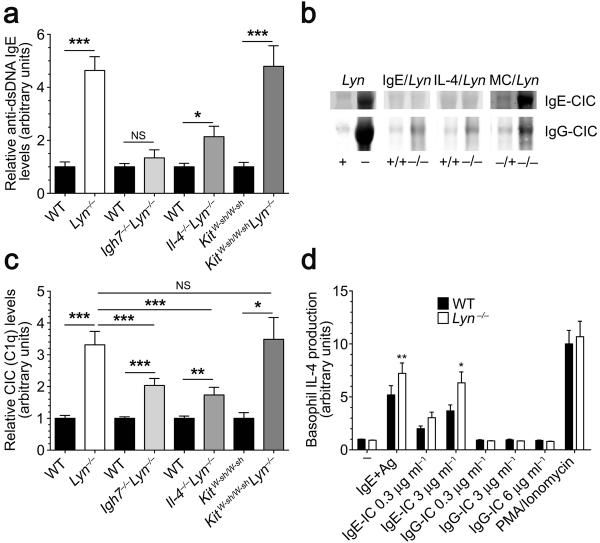
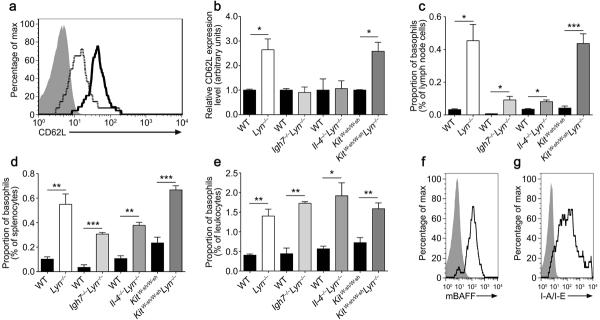
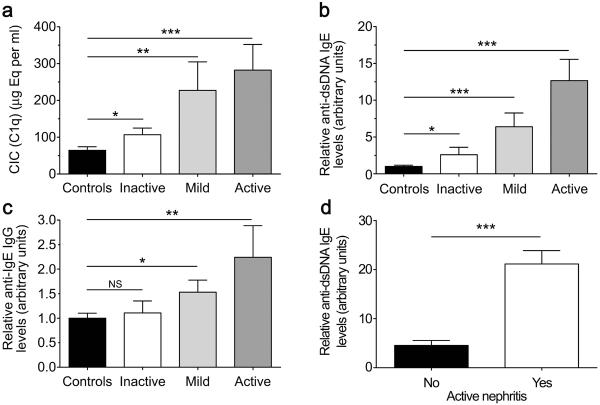
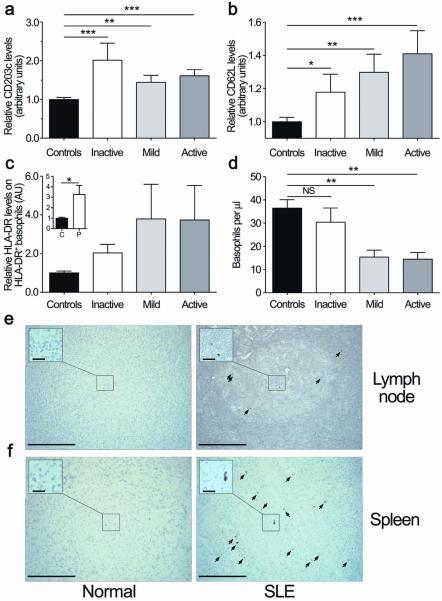
In systemic lupus erythematosus (SLE), self-reactive antibodies can target the kidney (lupus nephritis), leading to functional failure and possible mortality. We report that activation of basophils by autoreactive IgE causes their homing to lymph nodes, promoting T helper type 2 (T(H)2) cell differentiation and enhancing the production of self-reactive antibodies that cause lupus-like nephritis in mice lacking the Src family protein tyrosine kinase Lyn (Lyn(-/-) mice). Individuals with SLE also have elevated serum IgE, self-reactive IgEs and activated basophils that express CD62 ligand (CD62L) and the major histocompatibility complex (MHC) class II molecule human leukocyte antigen-DR (HLA-DR), parameters that are associated with increased disease activity and active lupus nephritis. Basophils were also present in the lymph nodes and spleen of subjects with SLE. Thus, in Lyn(-/-) mice, basophils and IgE autoantibodies amplify autoantibody production that leads to lupus nephritis, and in individuals with SLE IgE autoantibodies and activated basophils are factors associated with disease activity and nephritis.


Figures

Figure 1
Figure 1
The lupus-like nephritis of Lyn−/− mice is IL-4 and IgE dependent. (a) H&E stained histological kidney sections from aged mice (over 40 weeks) of the indicated genotype were scored for glomerulonephritis as indicated in methods. Data shown as means ± s.e.m (WT & Lyn−/−: n= 8; WT & Igh7−/−Lyn−/−: n=6; WT & Il-4−/−Lyn−/−: n= 4 and 5; KitW-sh/W-sh & KitW-sh/W-shLyn−/−: n= 11). Statistical analysis was by a two tailed unpaired student t test; ***: p<0.001; NS: not significant. (b) Representative glomeruli in H&E stained histological kidney sections of aged mice (40 weeks old) with the indicated genotype. Scale bar, 50 μm. (c) Immunofluorescent detection of glomerular IgG deposits in aged mice (40 weeks) of indicated genotypes after staining with fluorescein-conjugated anti-mouse IgG. Scale bar, 50 μm. (d) Albumin/Creatinine ratio (ACR) measured in the urine of at least 15 aged mice (40 weeks) of the indicated genotype. Data are means ± s.e.m. Statistical analysis was by a two tailed unpaired student t test; ***: p<0.001; NS: not significant.
Figure 2
Figure 2
IgE, basophils, and IL-4 regulate autoantibody production in Lyn−/− mice and basophils promote the kidney cytokine environment. (a) Quantitation of IgG anti-dsDNA in the serum of aged mice (40 weeks) of the indicated genotype. Data are means ± s.e.m (at least 15 mice per group). (b) Quantitation of IgG anti-nuclear antigen (ANA) in the above mice. (c) Quantitation of IgG ANA autoantibodies in the serum of aged mice (32 weeks) of the indicated genotype before (D0) and six days after (D6) injection of the basophil depleting antibody MAR-1 (−) or isotype control (+). Data are means ± s.e.m (WT: n= 3; Lyn−/− (+): n=4; Lyn−/− (−): n=5). (d) Same as (c) for the serum of mice (20 weeks-old) of the indicated genotype. Data are means ± s.e.m (for each group, n=3). (e) Proportion of splenic CD138+CD19+ plasma cells determined by flow cytometry in mice six days after basophil-depletion (−) or isotype injection (+). (f) Quantitation of IL-4 (left) and IFNγ (right) in kidney homogenates from 40 weeks old WT and Lyn−/− mice six days after basophil depletion (−) or isotype injection (+). Cytokine amounts were normalized to the total protein content of the respective homogenates. (e,f) Data are means ± s.e.m (WT and Lyn−/−, at least n=4 per group). Statistical analysis was by a two tailed unpaired (a,b,e,f) or paired (c,d) student t test; *: p<0.05; **: p<0.01; ***: p<0.001; NS: not significant.
Figure 3
Figure 3
Autoreactive IgE and IgE-circulating immune complexes (IgE-CIC) are present in the sera of aged Lyn−/− mice. (a) Anti-dsDNA IgE in the sera of aged mice (40 weeks), of the indicated genotype, was determined by semi-quantitative ELISA. Data are means ± s.e.m (> ten mice per group) normalized to the respective WT and expressed as arbitrary units. Statistical analysis was by a two tailed unpaired student t test; *: p<0.05; ***: p<0.001; NS: not significant. (b) IgE- and IgG-CIC were PEG-precipitated from serum samples of aged animals (>30 weeks) of the indicated genotype. The precipitated CIC were submitted to SDS-PAGE, transferred to nitrocellulose, and probed with anti-mouse IgE or anti-mouse IgG. One representative of at least ten mice per genotype is shown. (c) Serum levels of CIC (IgA+IgM+IgG) were determined by semi-quantitative ELISA from at least ten aged mice per genotype on complement factor 1q (C1q) coated plates. Data are means ± s.e.m normalized to levels in WT mice and reported as arbitrary units. Statistical analysis was by a two tailed unpaired student t test; *: p<0.05; **: p<0.01; ***: p<0.001; NS: not significant. (d) Basophil (bone marrow-derived) IL-4 production induced by the indicated stimuli. IL-4 production is expressed as the relative mean fluorescence intensity (MFI) detected by intracellular staining. The MFI was normalized to the unstimulated (−) control response. Data are means ± s.e.m. (n=6 per condition for three independent experiments). Statistical analysis was by using a two tailed paired student t test; *: p<0.05; **: p<0.01.
Figure 4
Figure 4
Basophils from aged Lyn−/− mice upregulate CD62L expression, home to secondary lymphoid tissues, and express membrane BAFF and MHC II. (a) Representative flow cytometric analysis of blood basophil CD62L expression in aged (40 weeks) WT (grey dashed line) and Lyn−/− mice (black line) relative to isotype control (grey fill). (b) Compilation of all experiments as in (a) from aged mice of the indicated genotype. Data are the mean fluorescence intensity (MFI) of CD62L expression on blood basophils normalized to corresponding WT controls expressed as means ± s.e.m (WT & Lyn−/−: n= 4 and 7; WT & Igh7−/−Lyn−/−: n=3; WT & Il-4−/−Lyn−/−: n= 3; KitW-sh/W-sh & KitW-sh/W-shLyn−/−: n= 4 & 7). Statistical analysis was by a two tailed unpaired student t test; *: p<0.05. (c–e) Flow cytometric analysis of basophils (defined as FcεRI+ CD11b+ CD49b+ cells) in lymph nodes (cervical and inguinal) relative to the total cell number (c), spleen (d), blood (e), of the indicated mice strains. (f, g) Representative flow cytometric analysis of basophil membrane BAFF (f) or MHC II (I-A/I-E) (g) expression in the lymph nodes of Lyn−/− mice (black line) relative to isotype control (grey fill).
Figure 5
Figure 5
IgE anti-dsDNA and IgG anti-IgE are associated with human SLE disease activity and lupus nephritis. (a) Total CIC's in serum from healthy controls (n=37), inactive SLE patients (SLEDAI=0) (n=13), patients with mild disease (SLEDAI 2.0 to ≤4.0) (n=15), and patients with active disease (SLEDAI >4) (n=15) were measured by ELISA. Data are means ± s.e.m. Statistical analysis was by a two tailed unpaired student t test; *: p<0.05; **: p<0.01; ***: p<0.001. (b) IgE anti-dsDNA was determined by semi-quantitative ELISA. dsDNA-coated plates were incubated with sera from healthy controls and SLE patients (same populations as in (a)). Data are means ± s.e.m (same n as in (a)) normalized to healthy controls. Statistical analysis was by a two tailed unpaired student t test; *: p<0.05; ***: p<0.001; NS: not significant. (c) IgG anti-IgE levels were determined by incubating sera from healthy controls and SLE patients on human IgE-coated plates, and anti-IgE IgG was detected with anti-human IgG (Fcγ specific). Data are means ± s.e.m (same n as in (a)) normalized to healthy controls. Statistical analysis was by a two tailed unpaired student t test; **: p<0.01. (d) IgE anti-dsDNA in sera of SLE patients classified on the basis of active nephritis (Yes, n=8) or not (No, n=34) (see Supplemental Methods). Data are means ± s.e.m. Statistical analysis was by a two tailed unpaired student t test.
Figure 6
Figure 6
Basophils in SLE patients are active, upregulate CD62L and HLA-DR, and home to secondary lymphoid organs. (a) Flow cytometric analysis of CD203c expression levels on blood basophils from healthy controls and inactive/mild/active SLE patients ((n=13/15/15) as described in Fig. 5a) relative to controls (n=41). Data are the ratio of CD203c mean fluorescence intensity (MFI) normalized to controls. (b) Same as in (a) showing expression of CD62L. Data are means ± s.e.m (healthy controls: n=14; SLE patients: inactive/moderate/active, n=4/6/6). (c) Flow cytometric analysis of relative HLA-DR levels on HLA-DR+ blood basophils compared to healthy controls. Data are means ± s.e.m (healthy controls: n=13; SLE patients: inactive/mild/active n=4/6/6). (d) Absolute number of blood basophils in healthy controls (n=41) or inactive/mild/active SLE patients (n=13/15/15) as determined by flow cytometry. Data are means ± s.e.m. (a–d) Statistical analysis was by a two tailed unpaired student t test; *: p<0.05; **: p<0.01; ***: p<0.001; NS: not significant. (e, f) Immunohistochemistry (with the 2D7 monoclonal antibody) of basophils in the lymph nodes (e) or spleen (f) of healthy (normal) controls or SLE patients (n=2). Basophils were found in the B cell zone of lymph node germinal centers for SLE patients only (e). A spleen biopsy from healthy (normal) controls or SLE patient shows the localization of basophils in the germinal centers of patients but not normals (f). Similar results were obtained with a second basophil specific antibody (BB1). Original magnification x20. Scale bar, 200 μm. (inset) Original magnification x40. Scale bar, 25 μm.

Comment in

Similar articles

Cited by

References

    1. Rahman A, Isenberg DA. Systemic lupus erythematosus. N Engl J Med. 2008;358:929–939. - PubMed
    1. Moser KL, Kelly JA, Lessard CJ, Harley JB. Recent insights into the genetic basis of systemic lupus erythematosus. Genes Immun. 2009;10:373–379. - PMC - PubMed
    1. Masutani K, et al. Predominance of Th1 immune response in diffuse proliferative lupus nephritis. Arthritis Rheum. 2001;44:2097–2106. - PubMed
    1. Balomenos D, Rumold R, Theofilopoulos AN. Interferon-gamma is required for lupus-like disease and lymphoaccumulation in MRL-lpr mice. J Clin Invest. 1998;101:364–371. - PMC - PubMed
    1. Peng SL, Szabo SJ, Glimcher LH. T-bet regulates IgG class switching and pathogenic autoantibody production. Proc Natl Acad Sci U S A. 2002;99:5545–5550. - PMC - PubMed

Publication types