Hypertrophic cardiomyopathy and dysregulation of cardiac energetics in a mouse model of biliary fibrosis
- PMID: 20512997
- PMCID: PMC3678910
- DOI: 10.1002/hep.23585
Hypertrophic cardiomyopathy and dysregulation of cardiac energetics in a mouse model of biliary fibrosis
Abstract
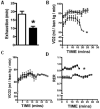
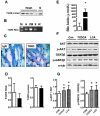
Cardiac dysfunction is a major cause of morbidity and mortality in patients with end-stage liver disease; yet the mechanisms remain largely unknown. We hypothesized that the complex interrelated impairments in cardiac structure and function secondary to progression of liver diseases involve alterations in signaling pathways engaged in cardiac energy metabolism and hypertrophy, augmented by direct effects of high circulating levels of bile acids. Biliary fibrosis was induced in male C57BL/6J mice by feeding a 0.1% 3,5-diethoxycarbonyl-1,4-dihydroxychollidine (DDC) supplemented diet. After 3 weeks, mice underwent live imaging (dual energy x-ray absorptiometry [DEXA] scanning, two-dimensional echocardiography [2DE], electrocardiography, cardiac magnetic resonance imaging), exercise treadmill testing, and histological and biochemical analyses of livers and hearts. Compared with chow-fed mice, DDC-fed mice fatigued earlier on the treadmill, with reduced VO(2). Marked changes were identified electrophysiologically (bradycardia and prolonged QT interval) and functionally (hyperdynamic left ventricular [LV] contractility along with increased LV thickness). Hearts of DDC-fed mice showed hypertrophic signaling (activation of v-akt murine thymoma viral oncogene/protein kinase B [AKT], inhibition of glycogen synthase kinase-3beta [GSK3beta], a 20-fold up-regulation of beta myosin heavy chain RNA and elevated G(s)alpha/G(i)alpha ratio. Genes regulating cardiac fatty acid oxidation pathways were suppressed, along with a threefold increase in myocardial glycogen content. Treatment of mouse cardiomyocytes (which express the membrane bile acid receptor TGR5) with potent natural TGR5 agonists, taurochenodeoxycholic acid and lithocholic acid, activated AKT and inhibited GSK3beta, similar to the changes seen in DDC-fed mouse hearts. This provides support for a novel mechanism whereby circulating natural bile acids can induce signaling pathways in heart associated with hypertrophy.
Conclusion: Three weeks of DDC feeding-induced biliary fibrosis leads to multiple functional, metabolic, electrophysiological, and hypertrophic adaptations in the mouse heart, recapitulating some of the features of human cirrhotic cardiomyopathy.
Figures


Similar articles
-
Protective role of cardiac-specific overexpression of caveolin-3 in cirrhotic cardiomyopathy.Am J Physiol Gastrointest Liver Physiol. 2020 Mar 1;318(3):G531-G541. doi: 10.1152/ajpgi.00346.2019. Epub 2020 Jan 21. Am J Physiol Gastrointest Liver Physiol. 2020. PMID: 31961720 Free PMC article.
-
Cardiomyopathy reverses with recovery of liver injury, cholestasis and cholanemia in mouse model of biliary fibrosis.Liver Int. 2015 Apr;35(4):1464-77. doi: 10.1111/liv.12438. Epub 2014 Jan 12. Liver Int. 2015. PMID: 24330504 Free PMC article.
-
Functional resilience of C57BL/6J mouse heart to dietary fat overload.Am J Physiol Heart Circ Physiol. 2021 Nov 1;321(5):H850-H864. doi: 10.1152/ajpheart.00419.2021. Epub 2021 Sep 3. Am J Physiol Heart Circ Physiol. 2021. PMID: 34477461 Free PMC article.
-
Type 1 diabetic cardiomyopathy in the Akita (Ins2WT/C96Y) mouse model is characterized by lipotoxicity and diastolic dysfunction with preserved systolic function.Am J Physiol Heart Circ Physiol. 2009 Dec;297(6):H2096-108. doi: 10.1152/ajpheart.00452.2009. Epub 2009 Oct 2. Am J Physiol Heart Circ Physiol. 2009. PMID: 19801494
-
Over-nutrition and metabolic cardiomyopathy.Metabolism. 2012 Sep;61(9):1205-10. doi: 10.1016/j.metabol.2012.02.013. Epub 2012 Mar 31. Metabolism. 2012. PMID: 22465089 Free PMC article. Review.
Cited by
-
Acute myocardial injury secondary to severe acute liver failure: A retrospective analysis supported by animal data.PLoS One. 2021 Aug 30;16(8):e0256790. doi: 10.1371/journal.pone.0256790. eCollection 2021. PLoS One. 2021. PMID: 34460845 Free PMC article.
-
Bile acids induce arrhythmias: old metabolite, new tricks.Heart. 2013 Nov;99(22):1629-30. doi: 10.1136/heartjnl-2013-304546. Epub 2013 Aug 22. Heart. 2013. PMID: 23969477 Free PMC article. No abstract available.
-
Emerging Roles of Gut Microbial Modulation of Bile Acid Composition in the Etiology of Cardiovascular Diseases.Nutrients. 2023 Apr 12;15(8):1850. doi: 10.3390/nu15081850. Nutrients. 2023. PMID: 37111068 Free PMC article. Review.
-
What Every Intensivist should Know about Impairment of Cardiac Function and Arrhythmias in Liver Disease Patients: A Review.Indian J Crit Care Med. 2020 Dec;24(12):1251-1255. doi: 10.5005/jp-journals-10071-23695. Indian J Crit Care Med. 2020. PMID: 33446981 Free PMC article. Review.
-
The impact of left ventricular hypertrophy on survival in candidates for liver transplantation.Liver Transpl. 2014 Jun;20(6):705-12. doi: 10.1002/lt.23875. Liver Transpl. 2014. PMID: 24659368 Free PMC article.
References
-
- Gaskari SA, Honar H, Lee SS. Therapy insight: Cirrhotic cardiomyopathy. Nat Clin Pract Gastroenterol Hepatol. 2006;3(6):329–337. - PubMed
-
- Henriksen JH, Moller S. Cardiac and systemic haemodynamic complications of liver cirrhosis. Scand Cardiovasc J. 2009:1–8. - PubMed
-
- Krag A, Bendtsen F, Henriksen JH, Moller S. Low cardiac output predicts development of hepatorenal syndrome and survival in patients with cirrhosis and ascites. Gut. 2009 - PubMed
-
- Epstein SK, Ciubotaru RL, Zilberberg MD, Kaplan LM, Jacoby C, Freeman R, et al. Analysis of impaired exercise capacity in patients with cirrhosis. Dig Dis Sci. 1998;43(8):1701–1707. - PubMed
Publication types
MeSH terms
Substances
Grants and funding
LinkOut - more resources
Full Text Sources
Medical
