

Impact of blood glucose self-monitoring errors on glucose variability, risk for hypoglycemia, and average glucose control in type 1 diabetes: an in silico study
- PMID: 20513321
- PMCID: PMC2901032
- DOI: 10.1177/193229681000400309
Impact of blood glucose self-monitoring errors on glucose variability, risk for hypoglycemia, and average glucose control in type 1 diabetes: an in silico study
Abstract
Background: Clinical trials assessing the impact of errors in self-monitoring of blood glucose (SMBG) on the quality of glycemic control in diabetes are inherently difficult to execute. Consequently, the objectives of this study were to employ realistic computer simulation based on a validated model of the human metabolic system and to provide potentially valuable information about the relationships among SMBG errors, risk for hypoglycemia, glucose variability, and long-term glycemic control.
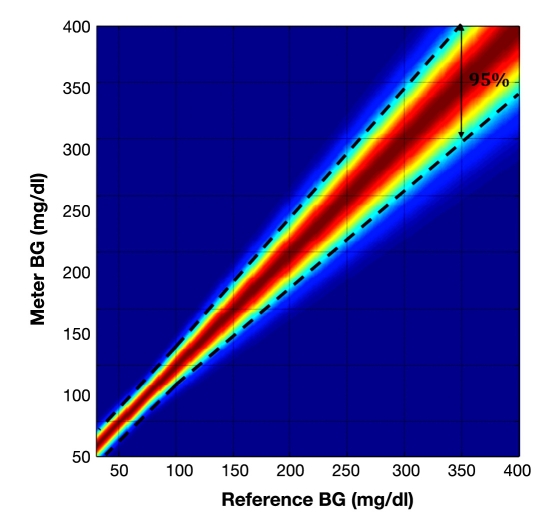
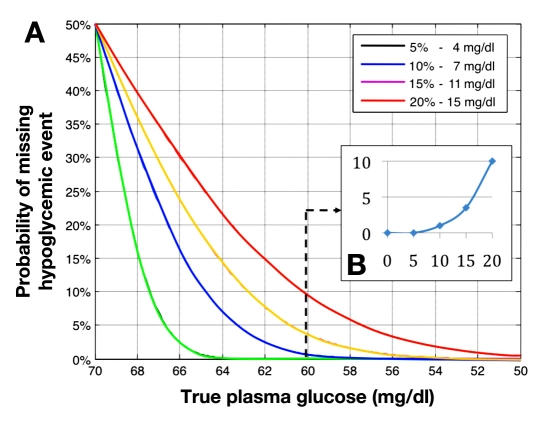
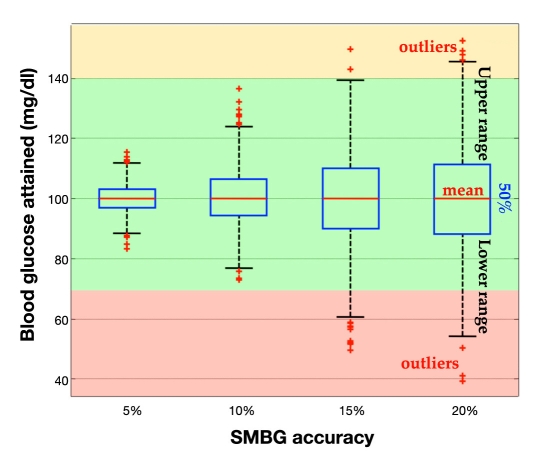
Methods: Sixteen thousand computer simulation trials were conducted using 100 simulated adults with type 1 diabetes. Each simulated subject was used in four simulation experiments aiming to assess the impact of SMBG errors on detection of hypoglycemia (experiment 1), risk for hypoglycemia (experiment 2), glucose variability (experiment 3), and long-term average glucose control, i.e., estimated hemoglobin A1c (HbA1c)(experiment 4). Each experiment was repeated 10 times at each of four increasing levels of SMBG errors: 5, 10, 15, and 20% deviation from the true blood glucose value.
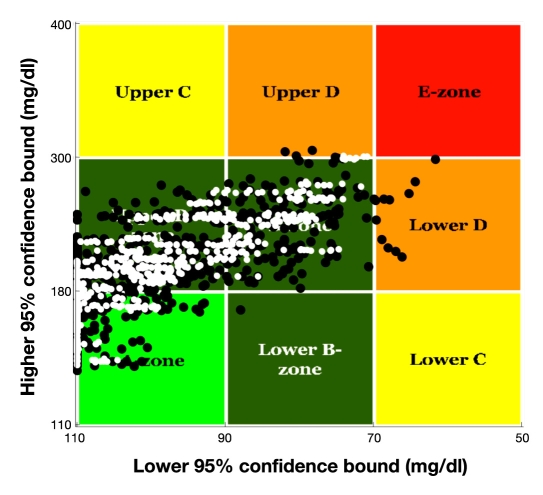
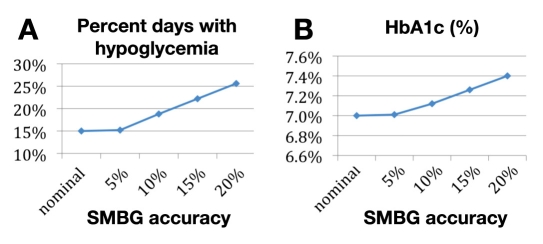
Results: When the permitted SMBG error increased from 0 to 5-10% to 15-20%-the current level allowed by International Organization for Standardization 15197-(1) the probability for missing blood glucose readings of 60 mg/dl increased from 0 to 0-1% to 3.5-10%; (2) the incidence of hypoglycemia, defined as reference blood glucose <or=70 mg/dl, changed from 0 to 0-0% to 0.1-5.5%; (3) glucose variability increased as well, as indicated by control variability grid analysis; and (4) the incidence of hypoglycemia increased from 15.0 to 15.2-18.8% to 22-25.6%. When compensating for this increase, glycemic control deteriorated with HbA1c increasing gradually from 7.00 to 7.01-7.12% to 7.26-7.40%.
Conclusions: A number of parameters of glycemic control deteriorated substantially with the increase of permitted SMBG errors, as revealed by a series of computer simulations (e.g., in silico) experiments. A threshold effect apparent between 10 and 15% permitted SMBG error for most parameters, except for HbA1c, which appeared to be increasing relatively linearly with increasing SMBG error above 10%.
(c) 2010 Diabetes Technology Society.
Figures
Similar articles
-
Economic Value of Improved Accuracy for Self-Monitoring of Blood Glucose Devices for Type 1 and Type 2 Diabetes in England.J Diabetes Sci Technol. 2018 Sep;12(5):992-1001. doi: 10.1177/1932296818769098. Epub 2018 Apr 21. J Diabetes Sci Technol. 2018. PMID: 29681171 Free PMC article.
-
Evaluation of blood glucose fluctuation in Japanese patients with type 1 diabetes mellitus by self-monitoring of blood glucose and continuous glucose monitoring.Diabetes Res Clin Pract. 2015 May;108(2):342-9. doi: 10.1016/j.diabres.2015.01.040. Epub 2015 Mar 4. Diabetes Res Clin Pract. 2015. PMID: 25779865 Clinical Trial.
-
Beyond HbA1c: Comparing Glycemic Variability and Glycemic Indices in Predicting Hypoglycemia in Type 1 and Type 2 Diabetes.Diabetes Technol Ther. 2018 May;20(5):353-362. doi: 10.1089/dia.2017.0388. Epub 2018 Apr 24. Diabetes Technol Ther. 2018. PMID: 29688755
-
Continuous Glucose Monitoring: A Brief Review for Primary Care Practitioners.Adv Ther. 2019 Mar;36(3):579-596. doi: 10.1007/s12325-019-0870-x. Epub 2019 Jan 18. Adv Ther. 2019. PMID: 30659511 Free PMC article. Review.
-
Assessing glycemia in diabetes using self-monitoring blood glucose and hemoglobin A1c.JAMA. 2006 Apr 12;295(14):1688-97. doi: 10.1001/jama.295.14.1688. JAMA. 2006. PMID: 16609091 Review.
Cited by
-
Performance of Cleared Blood Glucose Monitors.J Diabetes Sci Technol. 2015 Jul;9(4):895-910. doi: 10.1177/1932296815584797. Epub 2015 Jun 8. J Diabetes Sci Technol. 2015. PMID: 25990294 Free PMC article. Review.
-
The Financial Impact of Inaccurate Blood Glucose Monitoring Systems.J Diabetes Sci Technol. 2018 Mar;12(2):318-324. doi: 10.1177/1932296817731423. Epub 2017 Sep 26. J Diabetes Sci Technol. 2018. PMID: 28946757 Free PMC article.
-
Performance and System Validation of a New Cellular-Enabled Blood Glucose Monitoring System Using a New Standard Reference Measurement Procedure of Isotope Dilution UPLC-MRM Mass Spectrometry.J Diabetes Sci Technol. 2015 May 22;9(5):1061-70. doi: 10.1177/1932296815586016. J Diabetes Sci Technol. 2015. PMID: 26002836 Free PMC article.
-
Diabetes Complications and Related Comorbidities Impair the Accuracy of FreeStyle Libre, a Flash Continuous Glucose Monitoring System, in Patients with Type 2 Diabetes.Diabetes Metab Syndr Obes. 2022 Nov 3;15:3437-3445. doi: 10.2147/DMSO.S381565. eCollection 2022. Diabetes Metab Syndr Obes. 2022. PMID: 36353669 Free PMC article.
-
Accuracy and User Performance of a New Blood Glucose Monitoring System.J Diabetes Sci Technol. 2021 Nov;15(6):1382-1389. doi: 10.1177/1932296820974348. Epub 2020 Nov 26. J Diabetes Sci Technol. 2021. PMID: 33243009 Free PMC article.
References
-
- The Diabetes Control Complications Trial Research Group. The effect of intensive treatment of diabetes on the development and progression of long-term complications of insulin-dependent diabetes mellitus. N Engl J Med. 1993;329(14):977–986. - PubMed
-
- Reichard P, Phil M. Mortality and treatment side effects during long-term intensified conventional insulin treatment in the Stockholm Diabetes Intervention study. Diabetes. 1994;43(2):313–317. - PubMed
-
- UK Prospective Diabetes Study Group (UKPDS) Intensive blood-glucose control with sulphonylureas or insulin compared with conventional treatment and risk of complications in patients with type 2 diabetes. Lancet. 1998;352(9131):837–853. - PubMed
-
- White NH, Skor DA, Cryer PE, Levandoski L, Santiago JV. Identification of type I diabetic patients at increased risk for hypo-glycemia during intensive therapy. N Engl J Med. 1983;308(9):485–491. - PubMed
-
- Cryer PE, Gerich JE. Glucose counterregulation, hypoglycemia, and intensive therapy of diabetes mellitus. N Engl J Med. 1985;313(4):232–241. - PubMed
Publication types
MeSH terms
Substances
Grants and funding
LinkOut - more resources
Full Text Sources
Other Literature Sources
Medical
