

Noninvasive glucose monitoring: increasing accuracy by combination of multi-technology and multi-sensors
- PMID: 20513324
- PMCID: PMC2901035
- DOI: 10.1177/193229681000400312
Noninvasive glucose monitoring: increasing accuracy by combination of multi-technology and multi-sensors
Abstract
Background: The main concern in noninvasive (NI) glucose monitoring methods is to achieve high accuracy results despite the fact that no direct blood or interstitial fluid glucose measurement is performed. An alternative approach to increase the accuracy of NI glucose measurement was previously suggested through a combination of three NI methods: ultrasonic, electromagnetic, and thermal. This paper provides further explanation about the nature of the implemented technologies, and multi-sensors are presented, as well as a detailed elaboration on the novel algorithm for data analysis.
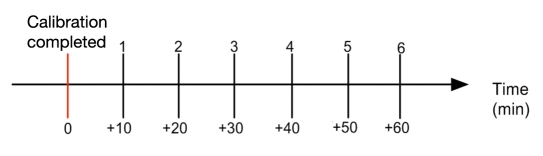
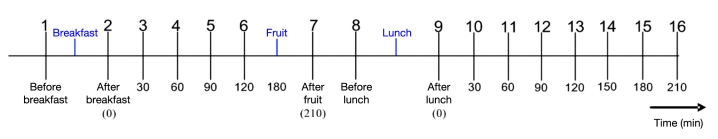
Methods: Clinical trials were performed on two different days. During the first day, calibration and six subsequent measurements were performed. During the second day, a "full day" session of about 10 hours took place. During the trial, type 1 and 2 diabetes patients were calibrated and evaluated with GlucoTrack glucose monitor against HemoCue (Glucose 201+).
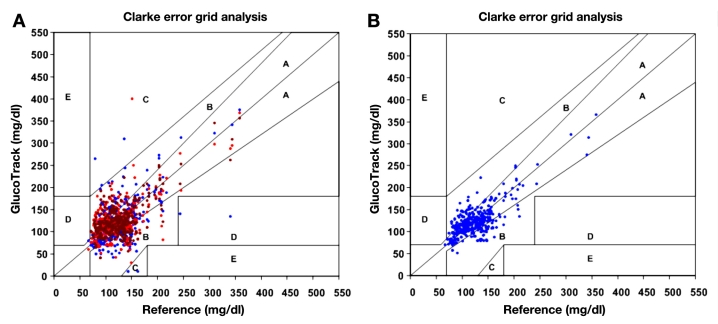
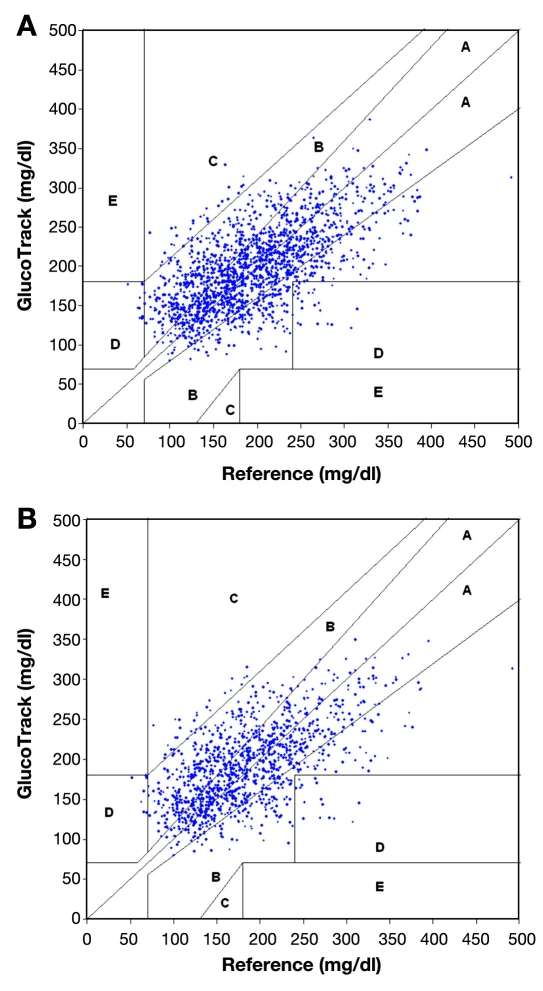
Results: A total of 91 subjects were tested during the trial period. Clarke error grid (CEG) analysis shows 96% of the readings (on both days 1 and 2) fall in the clinically accepted A and B zones, of which 60% are within zone A. The absolute relative differences (ARDs) yield mean and median values of 22.4% and 15.9%, respectively. The CEG for day 2 of the trial shows 96% of the points in zones A and B, with 57% of the values in zone A. Mean and median ARD values for the readings on day 2 are 23.4% and 16.5%, respectively. The intervals between day 1 (calibration and measurements) and day 2 (measurements only) were 1-22 days, with a median of 6 days.
Conclusions: The presented methodology shows that increased accuracy was indeed achieved by combining multi-technology and multi-sensors. The approach of integration contributes to increasing the signal-to-noise ratio (glucose to other contributors). A combination of several technologies allows compensation of a possible aberration in one modality by the others, while multi-sensor implementation enables corrections for interference contributions. Furthermore, clinical trials indicate the ability of using the device for a wide range of demography, showing clearly that the calibration is valid for long term.
(c) 2010 Diabetes Technology Society.
Figures
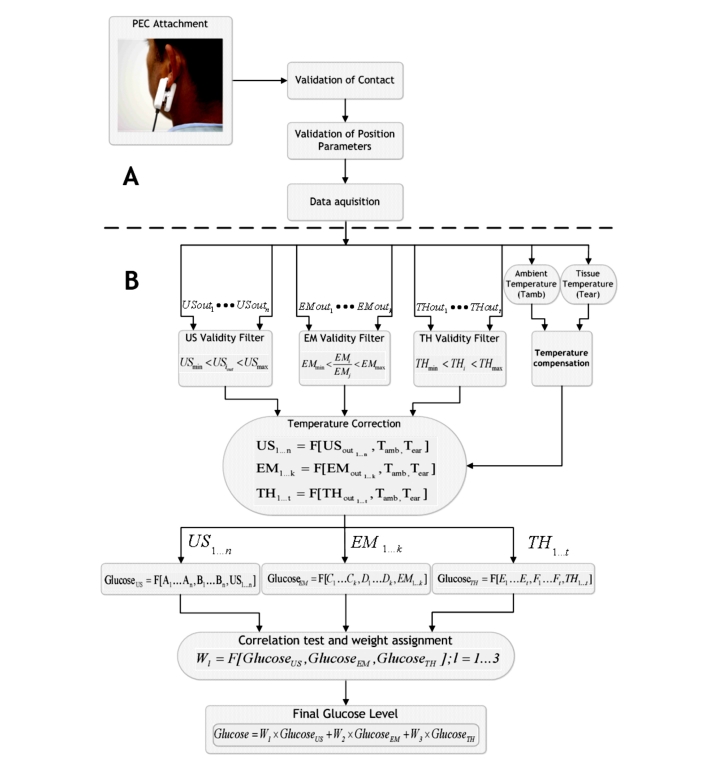
 ), thermal; (
 ), electromagnetic; (
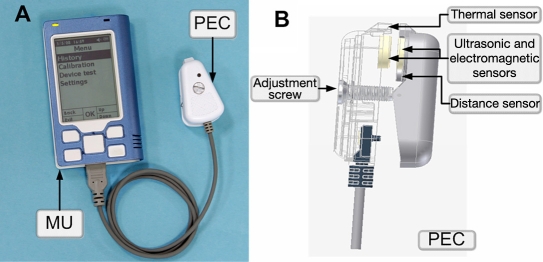
 ), ultrasonic] and (B) final combined glucose result.
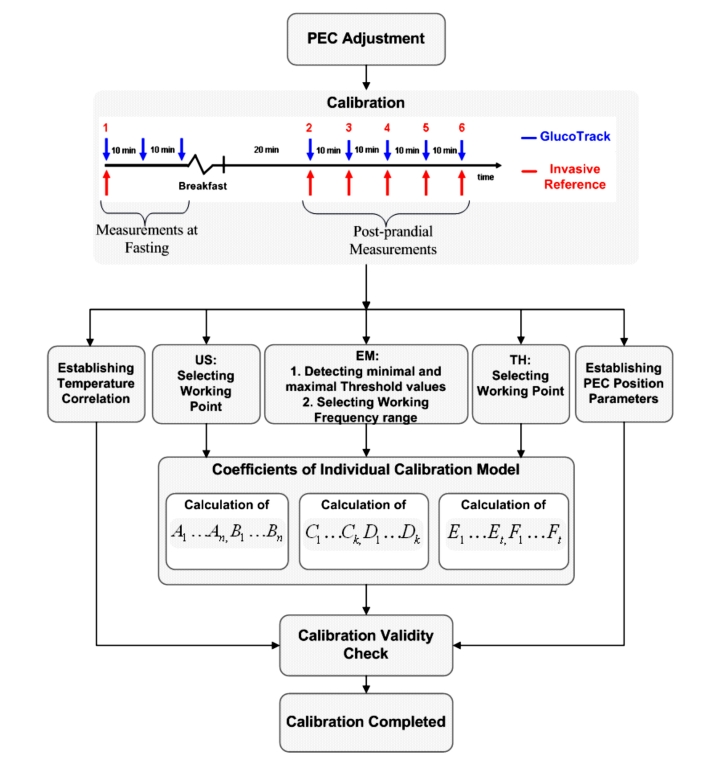
Similar articles
-
Noninvasive glucose monitoring: a novel approach.J Diabetes Sci Technol. 2009 Mar 1;3(2):253-60. doi: 10.1177/193229680900300205. J Diabetes Sci Technol. 2009. PMID: 20144356 Free PMC article. Clinical Trial.
-
New features and performance of a next-generation SEVEN-day continuous glucose monitoring system with short lag time.Diabetes Technol Ther. 2009 Dec;11(12):749-55. doi: 10.1089/dia.2009.0075. Diabetes Technol Ther. 2009. PMID: 20001675 Clinical Trial.
-
Evaluation of a New Noninvasive Glucose Monitoring Device by Means of Standardized Meal Experiments.J Diabetes Sci Technol. 2018 Nov;12(6):1178-1183. doi: 10.1177/1932296818758769. Epub 2018 Feb 16. J Diabetes Sci Technol. 2018. PMID: 29451016 Free PMC article. Clinical Trial.
-
Accuracy of flash glucose monitoring and continuous glucose monitoring technologies: Implications for clinical practice.Diab Vasc Dis Res. 2018 May;15(3):175-184. doi: 10.1177/1479164118756240. Epub 2018 Feb 15. Diab Vasc Dis Res. 2018. PMID: 29446646 Review.
-
Amperometric glucose sensors: sources of error and potential benefit of redundancy.J Diabetes Sci Technol. 2010 Jan 1;4(1):221-5. doi: 10.1177/193229681000400127. J Diabetes Sci Technol. 2010. PMID: 20167187 Free PMC article. Review.
Cited by
-
Low-cost portable microwave sensor for non-invasive monitoring of blood glucose level: novel design utilizing a four-cell CSRR hexagonal configuration.Sci Rep. 2020 Sep 16;10(1):15200. doi: 10.1038/s41598-020-72114-3. Sci Rep. 2020. PMID: 32938996 Free PMC article.
-
In vivo Microscopic Photoacoustic Spectroscopy for Non-Invasive Glucose Monitoring Invulnerable to Skin Secretion Products.Sci Rep. 2018 Jan 18;8(1):1059. doi: 10.1038/s41598-018-19340-y. Sci Rep. 2018. PMID: 29348411 Free PMC article.
-
Assessing the Performance of a Noninvasive Glucose Monitor in People with Type 2 Diabetes with Different Demographic Profiles.J Diabetes Res. 2017;2017:4393497. doi: 10.1155/2017/4393497. Epub 2017 Dec 20. J Diabetes Res. 2017. PMID: 29527535 Free PMC article.
-
The Progress of Glucose Monitoring-A Review of Invasive to Minimally and Non-Invasive Techniques, Devices and Sensors.Sensors (Basel). 2019 Feb 15;19(4):800. doi: 10.3390/s19040800. Sensors (Basel). 2019. PMID: 30781431 Free PMC article. Review.
-
Technologies for continuous glucose monitoring: current problems and future promises.J Diabetes Sci Technol. 2010 Nov 1;4(6):1540-62. doi: 10.1177/193229681000400632. J Diabetes Sci Technol. 2010. PMID: 21129353 Free PMC article. Review.
References
-
- American Diabetes Association. Economic costs of diabetes in the U.S. in 2007. Diabetes Care. 2008;31(3):596–615. - PubMed
-
- International Diabetes Federation. Diabetes atlas. 4th. Brussels: International Diabetes Federation; 2009. - PubMed
-
- The Diabetes Control and Complications Trial Research Group. The effect of intensive treatment of diabetes on the development and progression of long-term complications in insulin-dependent diabetes mellitus. N Engl J Med. 1993;329(14):977–986. - PubMed
-
- UK Prospective Diabetes Study (UKPDS) Group. Intensive blood-glucose control with sulphonylureas or insulin compared with conventional treatment and risk of complications in patients with type 2 diabetes (UKPDS33) Lancet. 1998;352(9131):837–853. - PubMed
-
- American Diabetes Association. Standards of medical care in diabetes—2006. Diabetes Care. 2006;29(Suppl 1):S4–42. - PubMed
Publication types
MeSH terms
Substances
LinkOut - more resources
Full Text Sources
Other Literature Sources
Medical
