. 2010 Jun 2;98(11):2524-34.
doi: 10.1016/j.bpj.2010.02.043.

Membrane bending energy and fusion pore kinetics in Ca(2+)-triggered exocytosis

Affiliations

Membrane bending energy and fusion pore kinetics in Ca(2+)-triggered exocytosis

Zhen Zhang et al. Biophys J. .

Abstract

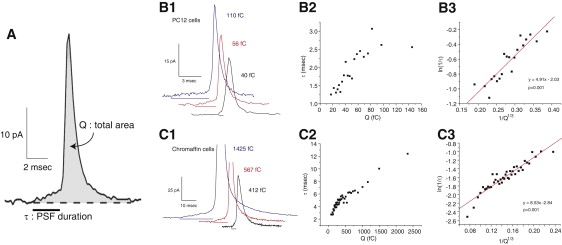
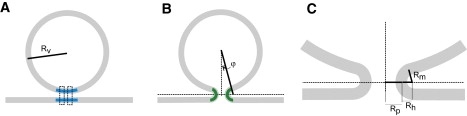
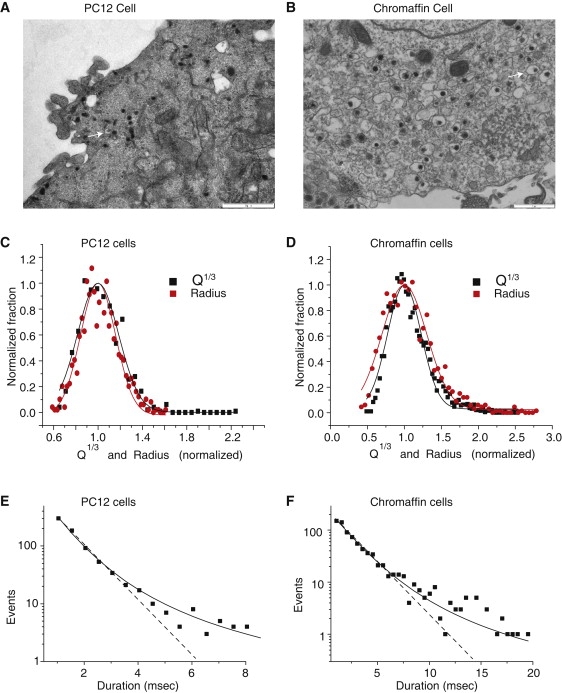
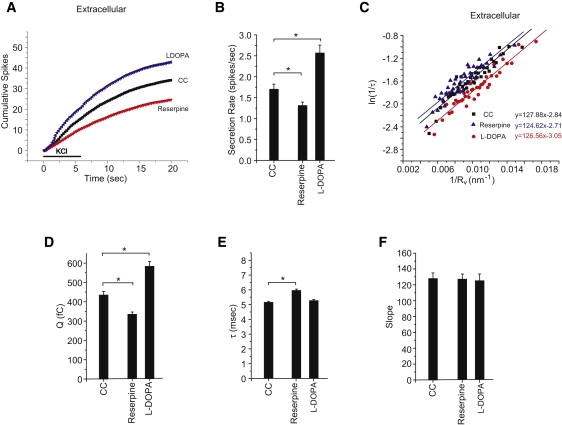
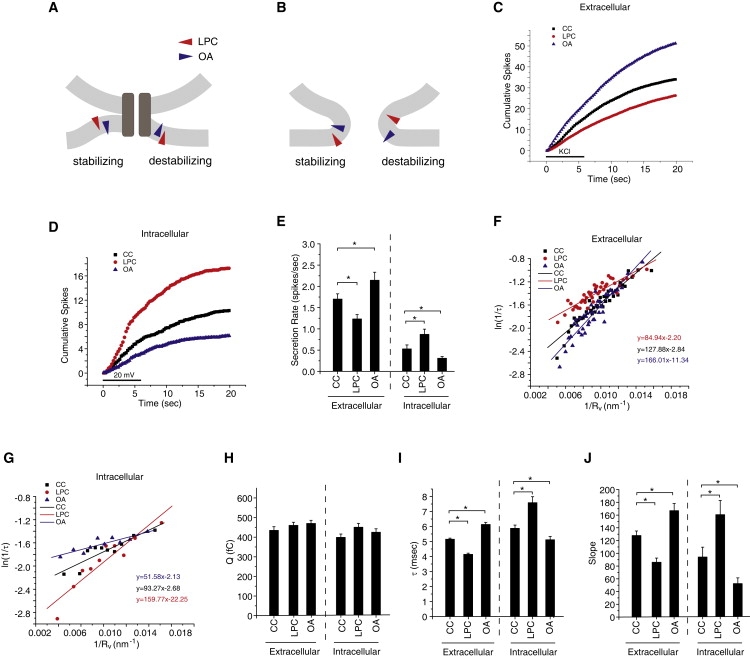
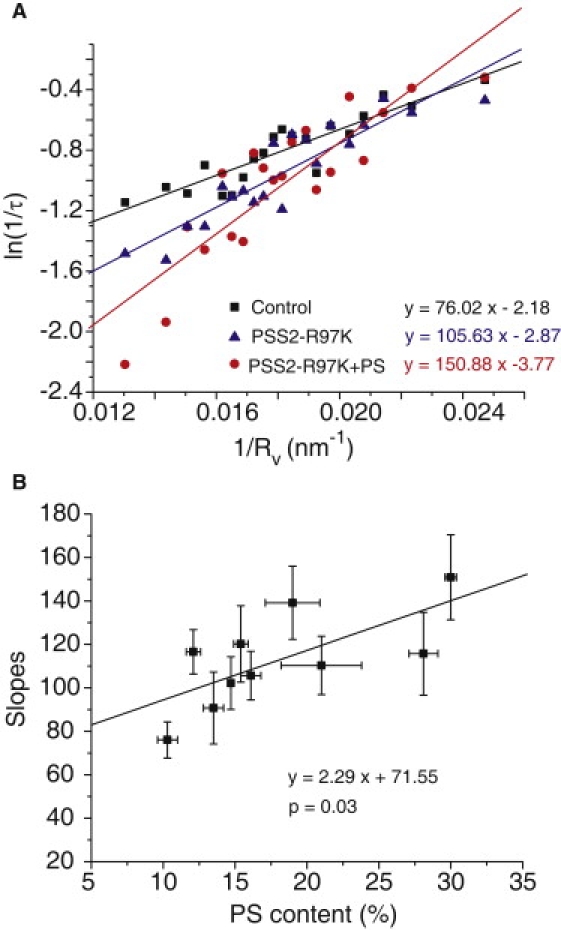
A fusion pore composed of lipid is an obligatory kinetic intermediate of membrane fusion, and its formation requires energy to bend membranes into highly curved shapes. The energetics of such deformations in viral fusion is well established, but the role of membrane bending in Ca(2+)-triggered exocytosis remains largely untested. Amperometry recording showed that during exocytosis in chromaffin and PC12 cells, fusion pores formed by smaller vesicles dilated more rapidly than fusion pores formed by larger vesicles. The logarithm of 1/(fusion pore lifetime) varied linearly with vesicle curvature. The vesicle size dependence of fusion pore lifetime quantitatively accounted for the nonexponential fusion pore lifetime distribution. Experimentally manipulating vesicle size failed to alter the size dependence of fusion pore lifetime. Manipulations of membrane spontaneous curvature altered this dependence, and applying the curvature perturbants to the opposite side of the membrane reversed their effects. These effects of curvature perturbants were opposite to those seen in viral fusion. These results indicate that during Ca(2+)-triggered exocytosis membrane bending opposes fusion pore dilation rather than fusion pore formation. Ca(2+)-triggered exocytosis begins with a proteinaceous fusion pore with less stressed membrane, and becomes lipidic as it dilates, bending membrane into a highly curved shape.


Figures

Figure 1
Figure 1
(A) An expanded view of a single-vesicle release event recorded by amperometry from a PC12 cell. The shaded region indicates the area of the entire event, which provides a measure of Q, the total vesicle content. The PSF duration, τ, indicated by the horizontal bar, is the lifetime of the initial fusion pore. Amperometry traces from PC12 cells (B1) and chromaffin cells (C1) show events with a larger Q are more likely to have longer τ. Q is stated for each displayed trace (1 C × 48,250 = mols of NE, assuming 1 mol of NE yields 2 electrons). Binning events with similar Q (50 events per bin), averaging τ for those events, and plotting shows a correlation for both PC12 cells (1163 spikes from 80 cells) (B2) and chromaffin cells (3956 spikes from 107 cells) (C2). Transforming to ln(1/τ) versus 1/Q1/3 gives linear plots for PC12 (B3) and chromaffin cells (C3).
Figure 2
Figure 2
(A) Initial state of vesicle (radius Rv) and plasma membrane. The membrane to be incorporated into a fusion pore is blue. The proteinaceous pore is indicated by two dotted rectangles. (B) Vesicle and plasma membrane connected by a lipidic fusion pore (green). The dotted horizontal line indicates the plane where the pore is narrowest. (C) A blow-up of the lipidic fusion pore shows key pore dimensions including the pore radius, Rp, the horizontal extension of the pore, Rh, and the distance along a radius through the pore-vesicle junction from the vesicle membrane to the horizontal plane, Rm. Appendix A derives an expression for the elastic energy of a fusion pore using these geometric parameters.
Figure 3
Figure 3
Electron micrographs of (A) PC12 cells and (B) chromaffin cells show dense-core vesicles (white arrows; scale bar = 1 μm). Distributions of Q1/3 from amperometry and vesicle radius (Rv) from electron microscopy, for (C) PC12 cells and (D) chromaffin cells. The distributions were normalized to the values at the peak (x coordinate) and maximum (y coordinate) of the fitted Gaussian. Gaussian fits gave means and standard deviations of 45.3 nm and 20.3 nm (Rv, PC12 cells); 3.53 fC1/3 and 1.84 fC1/3 (Q1/3, PC12 cells); 101.4 nm and 86.7 nm (Rv, chromaffin cells); 6.74 fC1/3 and 4.33 fC1/3 (Q1/3, chromaffin cells). Standard errors never exceeded 5% of the means. For diameters, 895 vesicles for PC12 cells and 1057 vesicles for chromaffin cells; for Q1/3 the data sets were from Fig. 1. Distributions of τ deviated from a single exponential for (E) PC12 cells and (F) chromaffin cells. The dotted line shows the exponential fit, and the solid curve shows the fit of Eq. 4 with Q01/3 and S0 fixed at the values from the fits in C and D, and β taken from the fits in Fig. 1, B3 and C3. The fits yielded α values of −1.71 ms−1 and −0.56 ms−1 for PC12 cells and chromaffin cells, respectively.
Figure 4
Figure 4
Vesicle size and exocytosis. (A) Cumulative spike-count time course in control chromaffin cells and cells treated with 100 nM reserpine or 100 μM L-DOPA (90 min each). Bar indicates depolarization with high KCl. (B) Secretion rates (spikes per cell in the first 20 s) from A. (C) ln(1/τ) versus 1/Rv plots. Q1/3 was converted to Rv using the scaling parameters from fits in Fig. 3D. Best fitting lines were drawn and stated in the corresponding color. (D) Mean Q values for each of the treatments tested in A. (E) Mean τ values. (F) Slopes from the linear fits in D. Indicates p < 0.05 by the Student's t-test. For extracellular additions, 1710–3956 spikes were recorded from 104–130 cells.
Figure 5
Figure 5
Membrane curvature and exocytosis. (A and B) Molecules with different effects on membrane curvature (colored triangles) stabilize or destabilize fusion pores depending on the side of the membrane. LPC (red) induces positive curvature by spreading the headgroups, and OA (blue) does the opposite. (A) For a proteinaceous pore, LPC induces curvature to favor a transition to a lipidic pore. OA at the same location induces curvature to oppose this transition. Presenting these molecules to the inside of a cell reverses their actions. (B) In a lipidic pore, LPC has a favorable interaction with the outside fusion pore membrane but an unfavorable interaction with the inside. OA has an unfavorable interaction with the outside but a favorable interaction with the inside. (C) Cumulative spike-count time course in control chromaffin cells and cells treated with 2 μM LPC, or 2 μM OA (added immediately before recording). The bar indicates depolarization with high KCl. (D) Cumulative spike-count time course in patch clamped chromaffin cells with control pipette solution and pipette solutions containing either 5 μM LPC or 5 μM OA. Note that patch clamping reduces secretion so control spike counts are lower in D than in B. (E) Secretion rates (spikes per cell in the first 20 s) from C and D. (F and G) ln(1/τ) versus 1/Rv plots in exocytosis. Q1/3 was converted to Rv using the scaling parameters obtained from fits in Fig. 3D. Best fitting lines were drawn and stated in the corresponding color. (H) Mean Q values for each of the treatments tested in C and D. (I) Mean τ values. (J) Slopes from the linear fits in F and G. Denotes p < 0.05 by the Student's t-test. For extracellular additions, 1245–3956 spikes were recorded from 96–153 cells. For intracellular additions, 339–563 spikes were recorded from 24–25 patch-clamped cells.
Figure 6
Figure 6
(A) Plots of ln(1/τ) versus 1/Rv for PC12 cells with different PS content. For control PC12 cells and cells expressing PS synthase 2 harboring the function enhancing mutation R97K, the PS contents were 10.7 ± 0.7% and 16.1 ± 0.7%, respectively. For cells expressing this enzyme and also treated with 100 μM PS for 1 day before recording, the PS content was 30.0 ± 0.4% (9). (B) The slopes of plots as in A were plotted versus PS content, showing a statistically significant dependence on PS content (p = 0.03).

References

    1. Chernomordik L.V., Kozlov M.M. Mechanics of membrane fusion. Nat. Struct. Mol. Biol. 2008;15:675–683. - PMC - PubMed
    1. Han X., Jackson M.B. Electrostatic interactions between the syntaxin membrane anchor and neurotransmitter passing through the fusion pore. Biophys. J. 2005;88:L20–L22. - PMC - PubMed
    1. Han X., Wang C.T., Jackson M.B. Transmembrane segments of syntaxin line the fusion pore of Ca2+-triggered exocytosis. Science. 2004;304:289–292. - PubMed
    1. Taraska J.W., Almers W. Bilayers merge even when exocytosis is transient. Proc. Natl. Acad. Sci. USA. 2004;101:8780–8785. - PMC - PubMed
    1. Jackson M.B., Chapman E.R. The fusion pores of Ca(2+)-triggered exocytosis. Nat. Struct. Mol. Biol. 2008;15:684–689. - PMC - PubMed

Publication types

MeSH terms