. 2010 May 28;38(4):603-13.
doi: 10.1016/j.molcel.2010.03.016.

Molecular maps of the reorganization of genome-nuclear lamina interactions during differentiation

Affiliations

Molecular maps of the reorganization of genome-nuclear lamina interactions during differentiation

Daan Peric-Hupkes et al. Mol Cell. .

Abstract

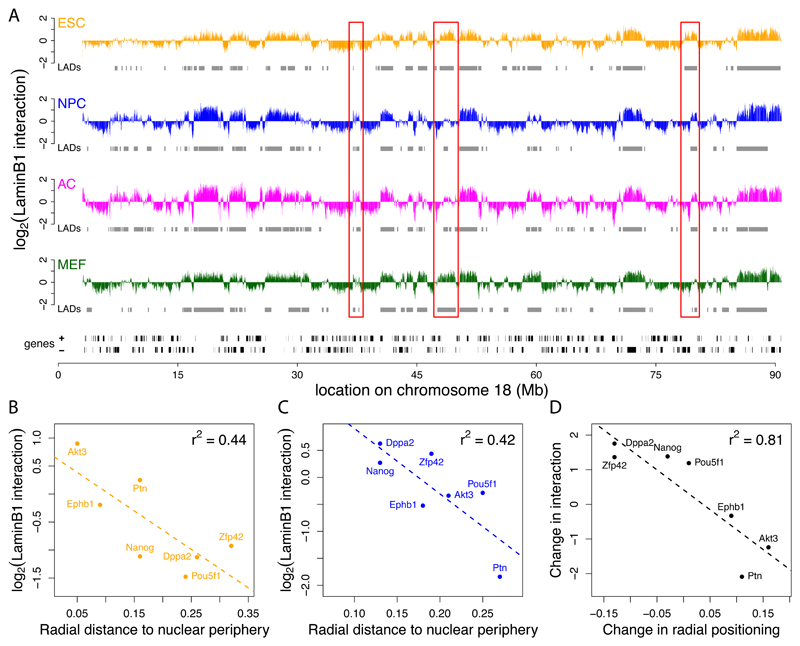
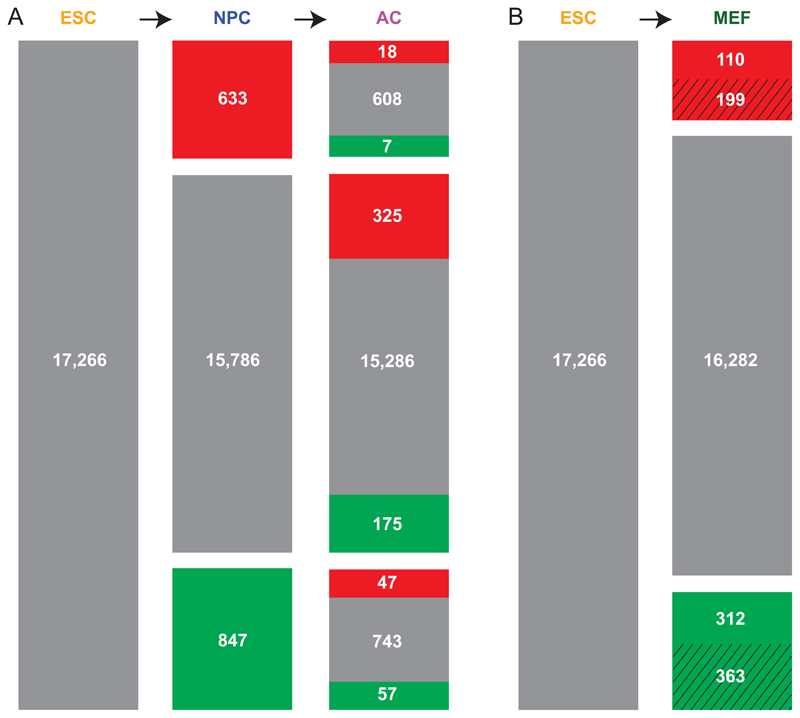
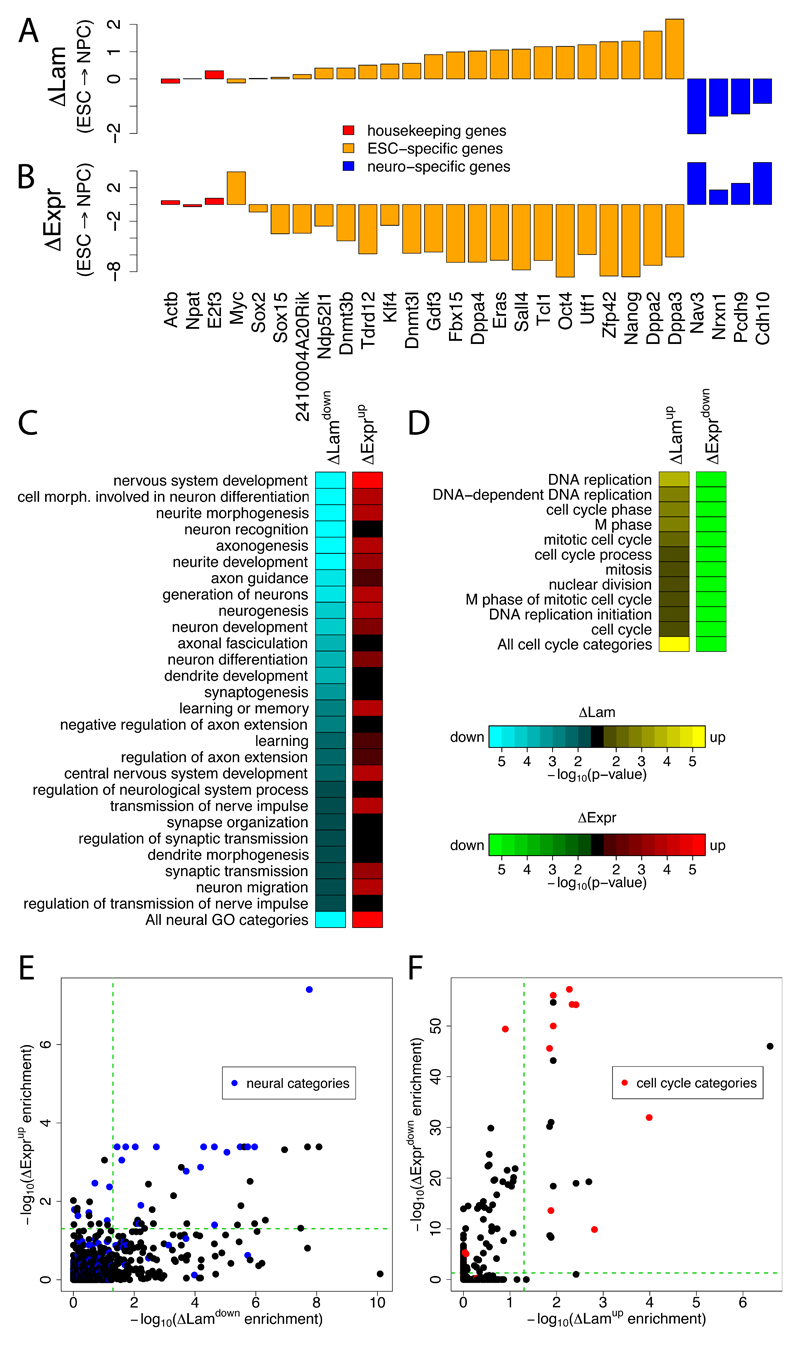
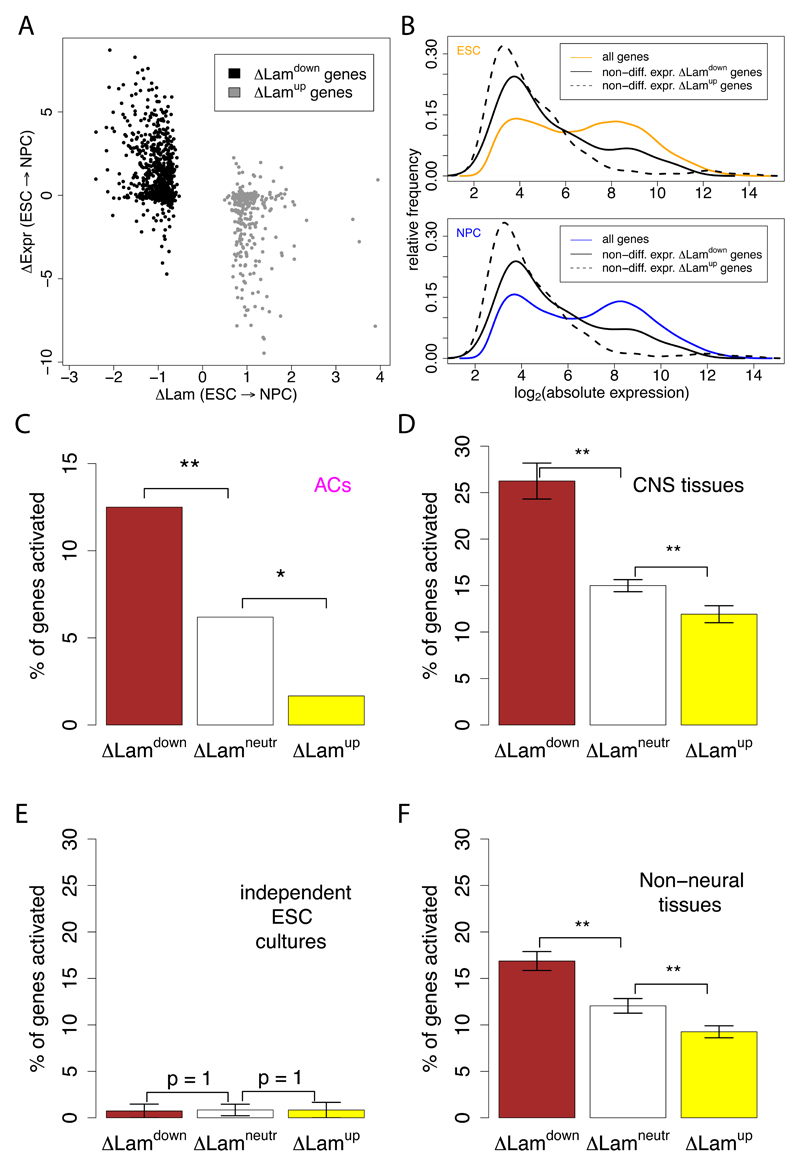
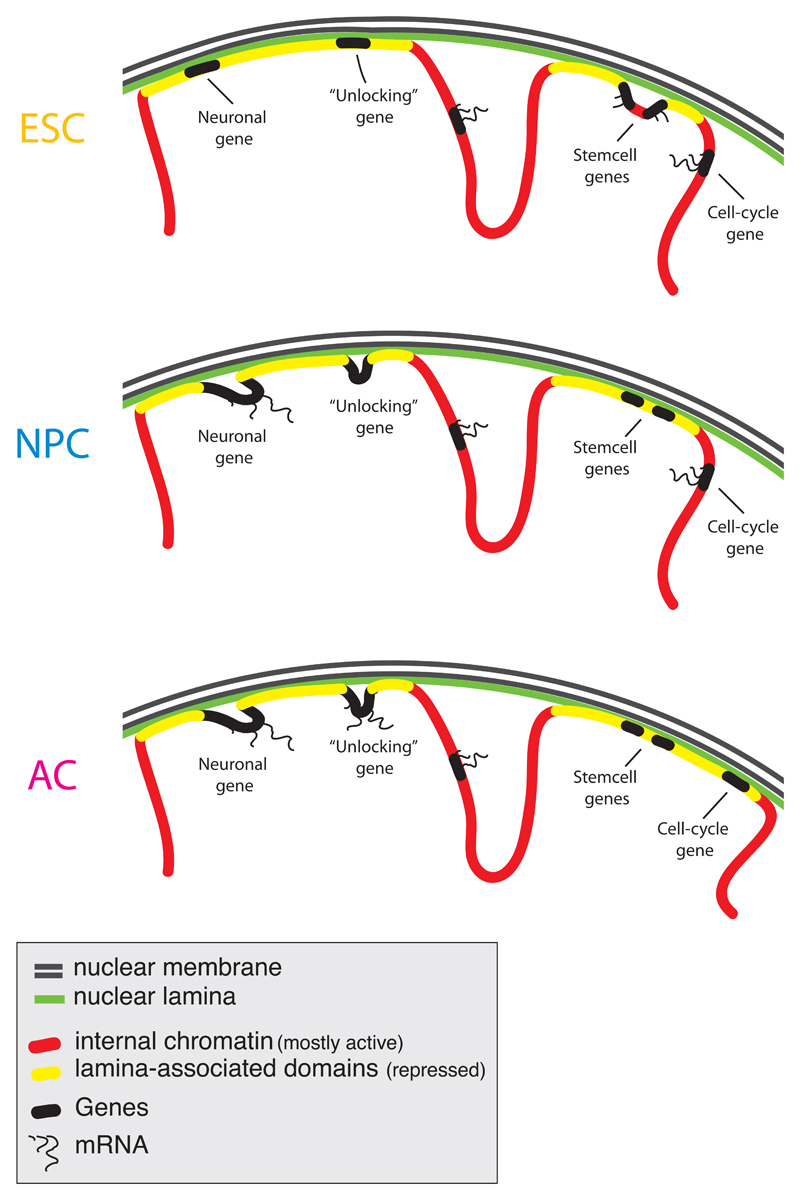
The three-dimensional organization of chromosomes within the nucleus and its dynamics during differentiation are largely unknown. To visualize this process in molecular detail, we generated high-resolution maps of genome-nuclear lamina interactions during subsequent differentiation of mouse embryonic stem cells via lineage-committed neural precursor cells into terminally differentiated astrocytes. This reveals that a basal chromosome architecture present in embryonic stem cells is cumulatively altered at hundreds of sites during lineage commitment and subsequent terminal differentiation. This remodeling involves both individual transcription units and multigene regions and affects many genes that determine cellular identity. Often, genes that move away from the lamina are concomitantly activated; many others, however, remain inactive yet become unlocked for activation in a next differentiation step. These results suggest that lamina-genome interactions are widely involved in the control of gene expression programs during lineage commitment and terminal differentiation.


Figures

Figure 1
Figure 1. Chromosomal maps of NL interactions.
(A) LaminB1 binding profiles for ESCs (orange), NPCs (blue), ACs (magenta), and MEFs (green) along mouse chromosome 18. Y-axis depicts the log2 transformed Dam-LmnB1 over Dam methylation ratio. Grey rectangles below each track represent LADs for each cell type, black rectangles at the bottom represent genes. Red boxes mark some regions of reorganization during differentiation. (B-D) FISH microscopy data validates NL interaction maps. Scatter plots showing correlation between the mean LaminB1 binding score per gene and the radial distance to the nuclear periphery as determined by FISH (Hiratani et al., 2008) in ESCs (B) and NPCs (C) for 7 loci. (D) Concordance between changes in NL interactions and changes in radial position upon ESC to NPC differentiation (p = 0.005621).
Figure 2
Figure 2. LADs are repressive chromatin regions in all four cell types.
Profiles across aligned LAD border regions (all borders; left and mirrored right border regions combined). To align data to LAD borders, genome-wide positions of all analysed features were converted to coordinates relative to the nearest border. Positive coordinates, inside LADs; negative coordinates, outside LADs. Colored lines show moving-window (A) mean averages with window sizes of 10 kb and (B-F) median averages with window sizes of 2% of all data within the plotting range. Data are shown for ESCs (orange) and NPCs (blue). (A) local gene density; (B) gene expression levels as determined by microarray profiling (Mikkelsen et al., 2007); (C) RNA Polymerase II and (D) H3K4me2 levels on promoters (Mohn et al., 2008); (E) replication timing (Hiratani et al., 2008); and (F) H3K9me2 levels (Wen et al., 2009). H3K9me2 data were not available for NPCs.
Figure 3
Figure 3. Changes in NL interactions involve single transcription units and multi-gene regions.
(A-C) Examples of genes that change NL interaction levels during differentiation. The log2 transformed Dam-LmnB1 over Dam methylation ratios are plotted for selected loci in ESCs (orange), NPCs (blue) and ACs (magenta). Corresponding H3K36me3 maps are shown for ESCs and NPCs (plotted in black, on orange respectively blue baselines) to indicate local transcription activity. (A) Neuron/glia-specific gene Pcdh9; (B) cell-cycle regulating gene E2f3; (C) stem cell marker genes Triml1 and Zfp42. H3K36me3 data was taken from (Mikkelsen et al., 2007). (D-E) Size distribution of relocating units during ESC→NPC transition, calculated as the number of neighboring genes with concordant significant decreases (D) or increases (E) in NL interaction levels. (F, G) Average profiles of the change in LaminB1-interaction along singleton ΔLamdown and ΔLamup genes. (F, G) Grey areas mark estimated 95% confidence intervals, the cut-offs on the x-axes are based on half the median gene size of the genes in each group.
Figure 4
Figure 4. Cumulative reorganization of NL-gene interactions in subsequent differentiation steps.
Out of a curated set of 17,266 genes, the numbers of genes are indicated that exhibit statistically significant increased (red) or decreased (green) levels of NL interactions compared to the preceding differentiation state. (A) ESC→NPC→AC lineage; (B) ESC→MEF lineage, which is a virtual lineage because the MEFs were not directly derived from the ESC culture. Striped areas represent genes that are also modified in one or both steps of the ESC→NPC→AC lineage.
Figure 5
Figure 5. Genes with altered NL interaction have cell type specific functions and expression levels.
(A-B) Log2 changes in LaminB1 interaction (ΔLam) (A) and gene expression levels (ΔExpr) (B) upon ESC→NPC differentiation, for ESC-specific (orange) (Takahashi and Yamanaka, 2006), neuron-specific (blue) and housekeeping (red) genes. (C,D) GO enrichment analysis. Green-to-red and cyan-to-yellow color scales reflect statistical signifance of changes in gene expression and NL interactions, respectively. (C) GO categories representing neural functions that show significant decreases in NL interactions during the ESC→NPC transition. (D) GO categories linked to cell cycle functions that show significant increases in NL interactions during the NPC→AC transition. (E-F) Scatter plots comparing -log10 corrected p-values for changes in NL interaction and changes in gene expression levels during the ESC→NPC (E) and NPC→AC (F) transitions. Blue dots, GO categories related to neural functions; red dots, GO categories related to cell cycle. Green dashed line marks cutoff for statistical significance (p<0.05).
Figure 6
Figure 6. Silent genes are preferentially activated after detachment from the NL.
(A) Scatterplot of the change in NL interaction (ΔLam) versus the change in gene expression (ΔExpr) during the ESC→NPC transition. Only genes with significantly increased (ΔLamup) and decreased (ΔLamdown) NL interactions are shown. (B) Distribution of log2 absolute expression levels of non-differentially expressed ΔLamup and ΔLamdown genes in ESCs (top) and NPCs (bottom), compared to all genes. (C-F) Differentiation-related activation of ΔLamdown, ΔLamneutral, and ΔLamup genes, as defined for the ESC→NPC transition. that are silent in both ESCs and NPCs. Bars show the percentage of genes that is activated in ACs (C); 10 central nervous system tissues (D); two independent ESC lines (E) and 77 non-neural tissues (F). In (D-F), each tissue or cell line was analyzed separately, and the results were averaged; error bars represent the standard error of the mean; ** indicates p<0.01 and * indicates p<0.05. Expression data for D, E, and F were taken from (Lattin et al., 2008). Note that values on the y-axes in D, E and F and not directly comparable to those in C, due to slightly different selection criteria for activated genes (see Methods).
Figure 7
Figure 7. Model of dynamic reshaping of NL-genome interactions during differentiation.
Overview of the changes in NL interactions for major gene classes during ESC→NPC and NPC→AC differentiaton steps.

Comment in

References

    1. Belmont AS, Zhai Y, Thilenius A. Lamin B distribution and association with peripheral chromatin revealed by optical sectioning and electron microscopy tomography. J Cell Biol. 1993;123:1671–1685. - PMC - PubMed
    1. Berger SL. The complex language of chromatin regulation during transcription. Nature. 2007;447:407–412. - PubMed
    1. Core LJ, Waterfall JJ, Lis JT. Nascent RNA sequencing reveals widespread pausing and divergent initiation at human promoters. Science. 2008;322:1845–1848. - PMC - PubMed
    1. Dekker J. Gene regulation in the third dimension. Science. 2008;319:1793–1794. - PMC - PubMed
    1. Efroni S, Duttagupta R, Cheng J, Dehghani H, Hoeppner DJ, Dash C, Bazett-Jones DP, Le Grice S, McKay RD, Buetow KH, et al. Global transcription in pluripotent embryonic stem cells. Cell Stem Cell. 2008;2:437–447. - PMC - PubMed

Publication types

Associated data