

Review
doi: 10.1016/j.jacc.2009.11.011.
ACCF/ACR/AHA/NASCI/SCMR 2010 expert consensus document on cardiovascular magnetic resonance: a report of the American College of Cardiology Foundation Task Force on Expert Consensus Documents
Collaborators
- PMID: 20513610
- PMCID: PMC3042771
- DOI: 10.1016/j.jacc.2009.11.011
Item in Clipboard
Review
ACCF/ACR/AHA/NASCI/SCMR 2010 expert consensus document on cardiovascular magnetic resonance: a report of the American College of Cardiology Foundation Task Force on Expert Consensus Documents
J Am Coll Cardiol.
.
No abstract available
Figures

Panel A: T2-weighted image of LV myocardial edema showing global bright signal intensity (ratio 2.2) of the left ventricle relative to the myocardium. Panel B: Early enhancement (T1-weighted spin echo) before (left) and after (right) Gd administration; enhancement ratio 5.4. Panel C: Arrows indicating late enhancement (T1-weighted gradient echo sequence with myocardial nulling) 10 minutes after Gd. Gd indicates gadolinium; and LV, left ventricular.

An oblique axial reconstruction is presented from a “whole-heart coronary MRA” sequence. The white arrow notes the normally arising left main coronary artery from the left sinus of Valsalva. The black arrowhead highlights the right coronary artery arising anomalously from the anterior aspect of the left sinus of Valsalva superior to the left main origin and then coursing between the aortic root and the outflow tract of the right ventricle. MRA indicates magnetic resonance angiography.

A 3-dimensional volume-rendered reconstruction from a “whole-heart coronary MRA” sequence in a patient with single ventricle and a single coronary artery. The white arrow denotes the proximal right coronary artery, whereas the black arrow highlights the elongated left main coronary artery arising from a common origin with the right coronary artery. MRA indicates magnetic resonance angiography.
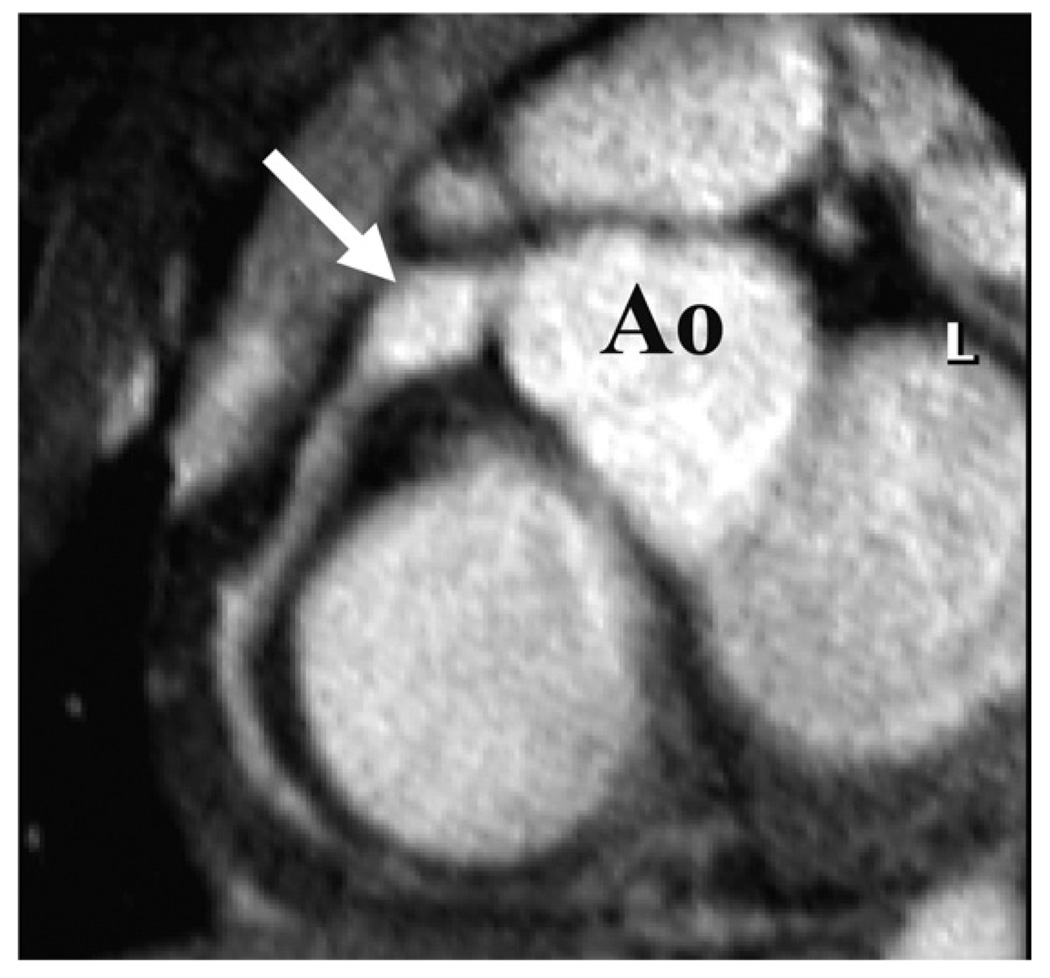
Transverse targeted 3-dimensional T2 prepulse coronary MRA of a subject with a proximal right coronary artery aneurysm. Ao indicates aorta; L, left coronary artery; and MRA, magnetic resonance angiography.
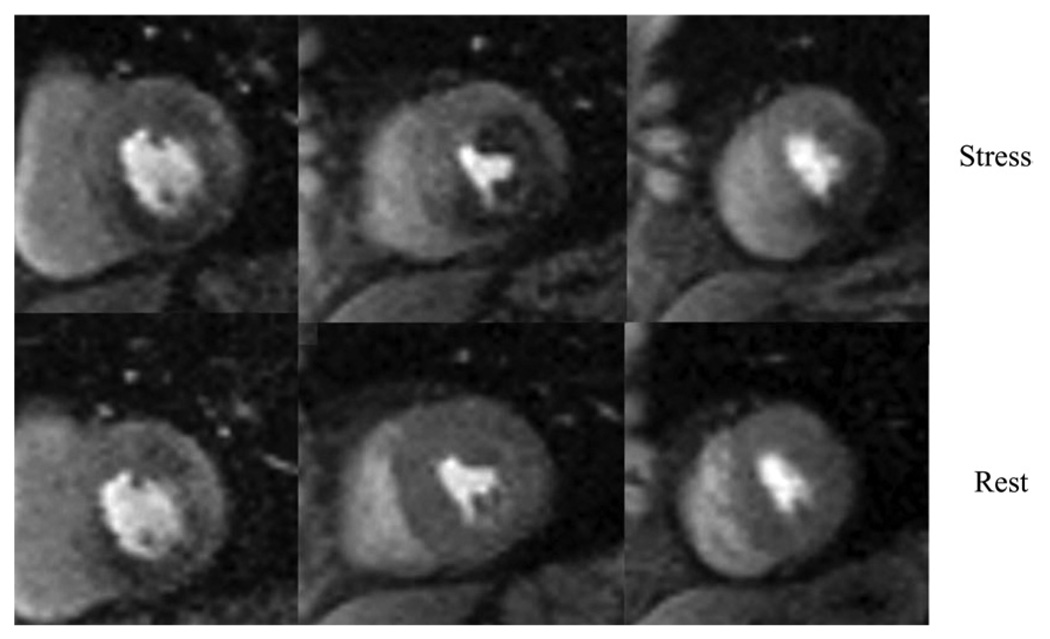
First-pass contrast-enhanced perfusion images from a 73-year-old diabetic man using a hybrid gradient echo–echo planar pulse sequence with parallel imaging during infusion of 0.075 mM/kg of gadolinium chelate at 4 cc/s. The top panel of short-axis images was obtained during adenosine stress, a 4-minute infusion at 0.14 mg/kg, and the bottom panel obtained in the same short-axis slices 10 minutes later at rest. The base of the left ventricle on the left demonstrates an inferior wall perfusion abnormality seen at both stress and rest, consistent with myocardial infarction. The mid left ventricle demonstrates a large perfusion defect only at stress in the anterolateral and inferior walls. The apical left ventricle shows an inferolateral perfusion defect at stress but is normal at rest. cc indicates cubic centimeter; and mM, millimolar.

Images from the same patient as in Figure 5. The panel of images demonstrates phase-sensitive inversion recovery gradient echo images in the same 3 short-axis locations obtained 10 minutes after 0.15 mM/kg of gadolinium was infused intravenously. The basal left ventricle shows a 50% transmural inferior infarction while the mid and apical left ventricle show a 25% to 50% transmural inferior infarction. Putting this data together with Figure 5, the findings are consistent with an inferior infarction with peri-infarct ischemia in the mid and apical inferior walls as well as mid anterolateral ischemia, consistent with multivessel coronary artery disease. mM indicates millimolar.
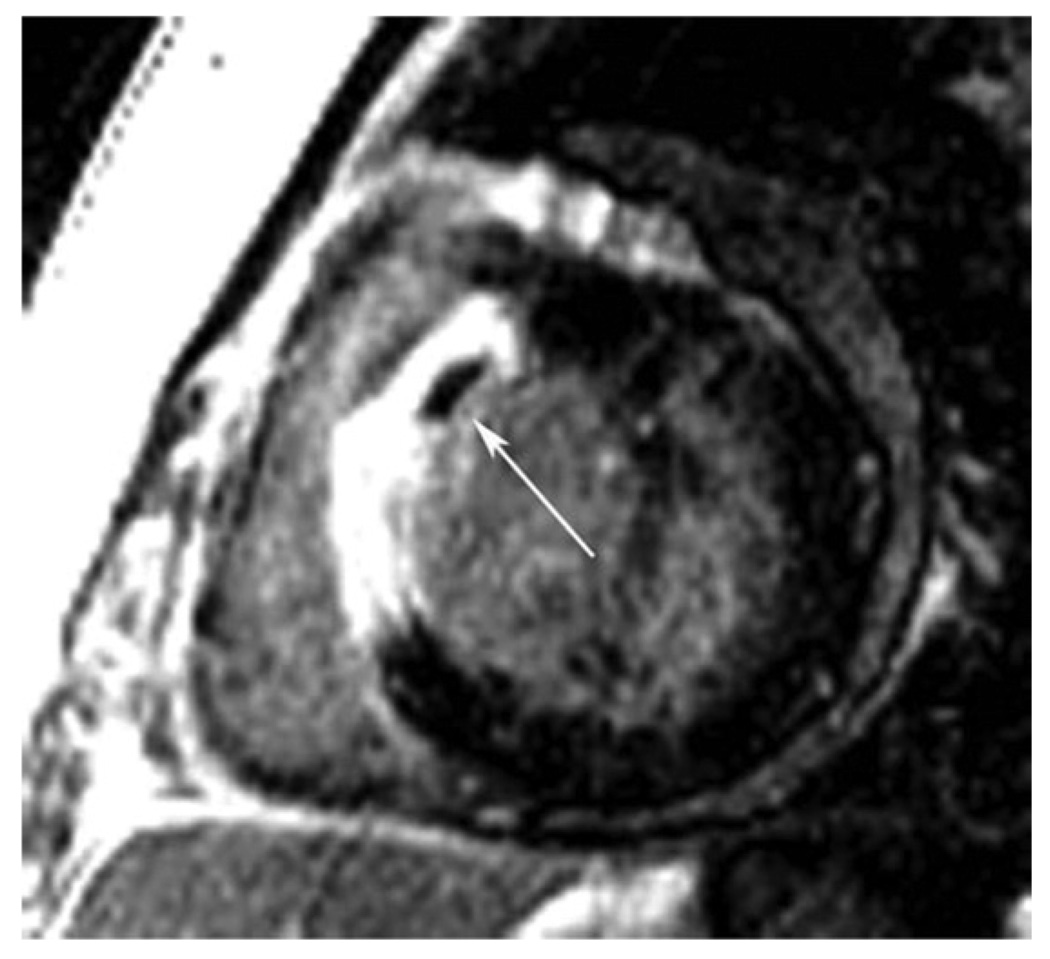
This figure is a short-axis late gadolinium-enhanced inversion recovery gradient echo axis image obtained 10 minutes after gadolinium infusion in a patient on Day 3 after reperfused anteroseptal myocardial infarction. Note the transmural late gadolinium enhancement in the anteroseptum. The arrow points to a region of microvascular obstruction in the core of the infarction that represents a region of capillary damage to the extent that contrast is unable to fill this region even 10 minutes after contrast. MO is generally only seen in the first 7 to 10 days postmyocardial infarction and signifies an infarction and patient with poorer prognosis than those without MO. MO indicates microvascular obstruction.
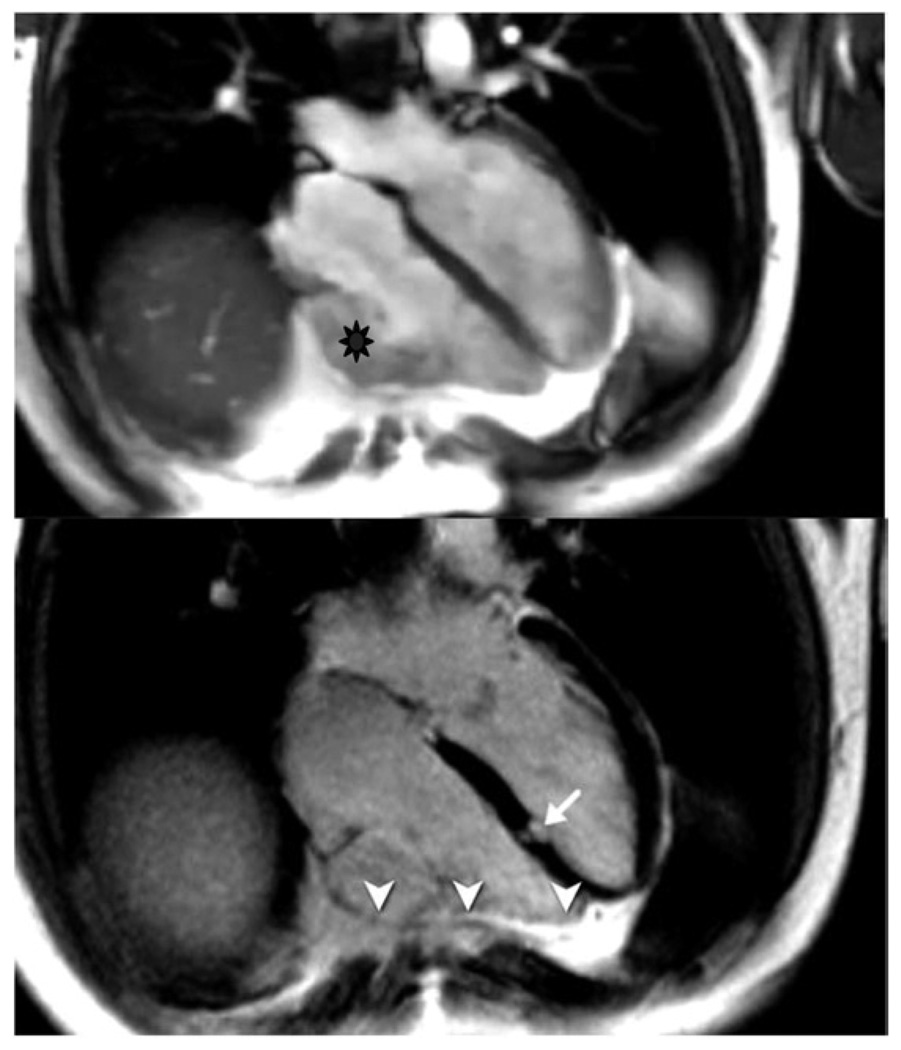
Upper panel: irregular silhouette of the free RV wall with microaneurysm. Lower panel: evidence for LGE of the RV wall (arrowheads), but also focal fibrosis of the interventricular septum (arrow). ARVC indicates arrhythmogenic right ventricular cardiomyopathy; LGE, late gadolinium enhancement; and RV, right ventricular.

Upper panels: systolic long-axis (left) and short-axis (right) still frames. Lower panels: left: short-axis late Gd enhancement image showing several areas of fibrosis. Right: late Gd enhancement study using a short inversion time (fibrosis appears with low SI). Confirmation of lesions in the myocardium (arrows) and in the trabecular tissue (arrowhead) are shown. Gd indicates gadolinium; LGE, late gadolinium enhancement; and SI, signal intensities.

Images obtained by different sequences in the same 2-chamber view are shown. Panels A (diastolic) and B (systolic) indicate a basal-anterior and apical-inferior wall motion abnormality. Panel C shows increased signal intensity in a T2-weighted image, indicating edema as a feature of acute injury (arrowheads). Note the increased signal of the apical blood due to slow blood flow (thin arrow). Panel D visualizes a delayed gadolinium washout indicating irreversible injury (arrowheads).

Left panel: long-axis view of a late gadolinium enhancement study showing a transmural lesion in the basal lateral wall (arrow). Right panel: cross-referenced short-axis view with the same lesion (arrow).
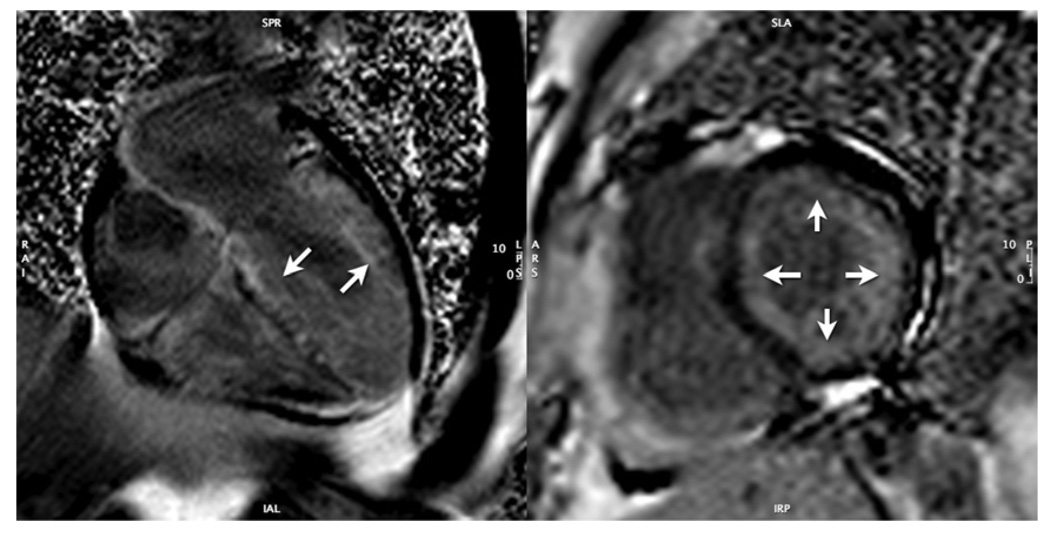
Left panel: long-axis view of a late Gd enhancement study (10 min post Gd administration) showing extensive, diffuse myocardial Gd uptake (arrows) with early clearance from blood pool (low signal intensity of the ventricular lumen). Right panel: confirmative short-axis view showing the mainly subendocardial distribution of the Gd (arrow). Gd indicates gadolinium.

Panel A: a short-axis, cine-tagged imaging is provided. Along the posterior wall of the left ventricle (white arrow), tag deformation is absent, indicating pericardial adhesions. Panel B: dark blood T1-weighted spin echo images are provided, indicating thickened pericardium along the anterior surface of the right ventricle and corresponding tubular deformity of the ventricles. Advanced lung disease is also noted.

The upper left panel is a cine CMR of a patient with double outlet right ventricle demonstrating semilunar valve morphology. The PV is trileaflet, whereas the AoV is bicuspid. The lower left panel is a 3-dimensional reconstruction of a single-ventricle patient after aortic to pulmonary anastamosis (arrow on leftward image, which is an anteroposterior view) and a bilateral bidirectional cavopulmonary connection where the LSVC and RSVC are connected to the LPAs and RPAs (best visualized on the rightward image, which is a posterior view). The rightward panels are from a patient with tetralogy of Fallot after repair with pulmonary regurgitation using through-plane phase-contrast imaging of the MPA. This technique encodes flow into and out of the imaging plane with directionality encoded as white or black; the top image demonstrates antegrade flow (white), and the bottom image demonstrates retrograde or regurgitant flow (black). The frames were acquired at peak systole and diastole. AoV indicates aortic valve; CMR, cardiovascular magnetic resonance; LPA, left pulmonary artery; LSVC, left superior vena cava; MPA, main pulmonary artery; PV, pulmonary valve; RPA, right pulmonary artery; and RSVC, right superior vena cava.

Bolus chase CE-MRA of the aorta and lower extremity arteries obtained with a 3–stage table-stepping protocol during infusion of 0.2 mM/kg of gadolinium chelate in a patient with peripheral arterial disease. There is evidence of sequential moderate stenoses in the left superficial femoral artery (upper arrow), as well as runoff disease in the left calf (lower arrow). CE-MRA indicates contrast-enhanced magnetic resonance angiography; and mM, millimolar.
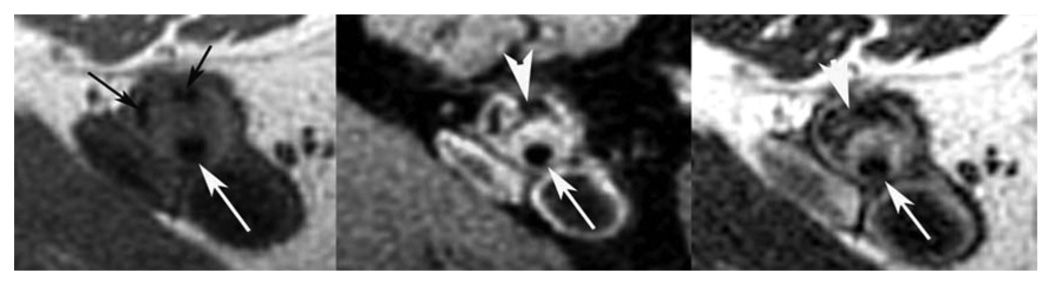
Multispectral atherosclerotic plaque imaging of the SFA in the same patient as Figure 10 with a T1-W image on the left, PDW image in the middle, and T2-W image on the right. The lumen is preserved (long white arrows), yet there is significant atherosclerotic plaque in the wall. The black arrows on the T1-W image point to areas of low signal consistent with calcification (seen on all 3 image weightings). The large white arrowheads point to areas of low signal on the PDW and T2-W images that are consistent with lipid-rich necrotic core. The brighter areas around the lumen on PDW and T2-W images represent fibrous tissue. PDW indicates proton density–weighted; SFA, superficial femoral artery; T1-W, T1-weighted; and T2-W, T2-weighted.
References
-
- Saini S, Frankel RB, Stark DD, et al. Magnetism: a primer and review. AJR Am J Roentgenol. 1988;150:735–743. - PubMed
-
- Pettigrew RI. Dynamic cardiac MR imaging: techniques and applications. Radiol Clin North Am. 1989;27:1183–1203. - PubMed
-
- Hundley WG, Li HF, Willard JE, et al. Magnetic resonance imaging assessment of the severity of mitral regurgitation: comparison with invasive techniques. Circulation. 1995;92:1151–1158. - PubMed
-
- Gandy SJ, Waugh SA, Nicholas RS, et al. Comparison of the reproducibility of quantitative cardiac left ventricular assessments in healthy volunteers using different MRI scanners: a multicenter simulation. J Magn Reson Imaging. 2008;28:359–365. - PubMed
-
- Edelman RR, Chien D, Kim D. Fast selective black blood MR imaging. Radiology. 1991;181:655–660. - PubMed
Publication types
MeSH terms
Grants and funding
LinkOut - more resources
Full Text Sources
Other Literature Sources
Medical
