. 2010 Aug;31(8):1344-53.
doi: 10.1093/carcin/bgq108. Epub 2010 May 31.

Insulin-like growth factor-binding protein-3 promotes transforming growth factor-{beta}1-mediated epithelial-to-mesenchymal transition and motility in transformed human esophageal cells

Affiliations

Insulin-like growth factor-binding protein-3 promotes transforming growth factor-{beta}1-mediated epithelial-to-mesenchymal transition and motility in transformed human esophageal cells

Mitsuteru Natsuizaka et al. Carcinogenesis. 2010 Aug.

Abstract

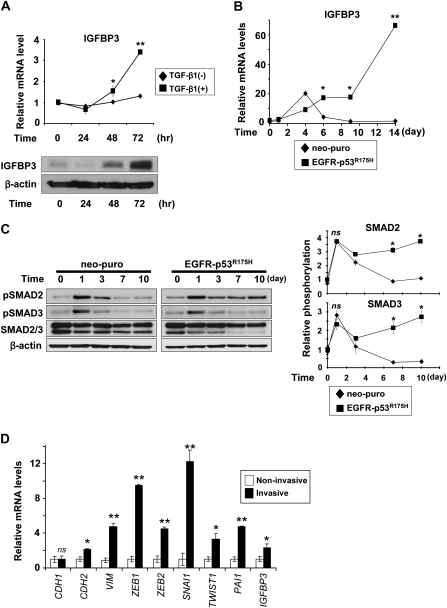
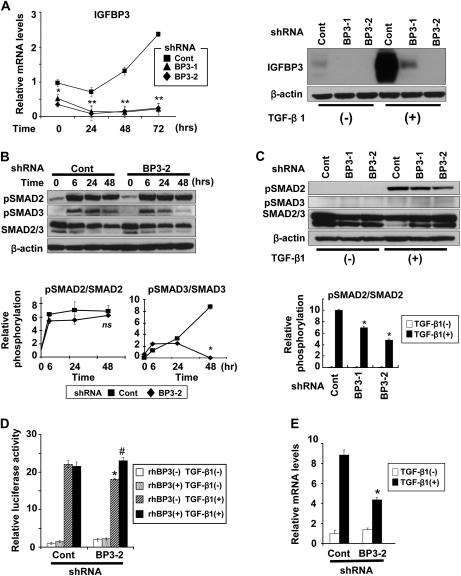
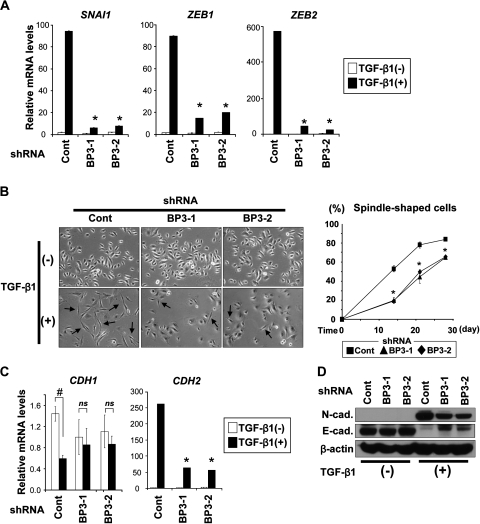
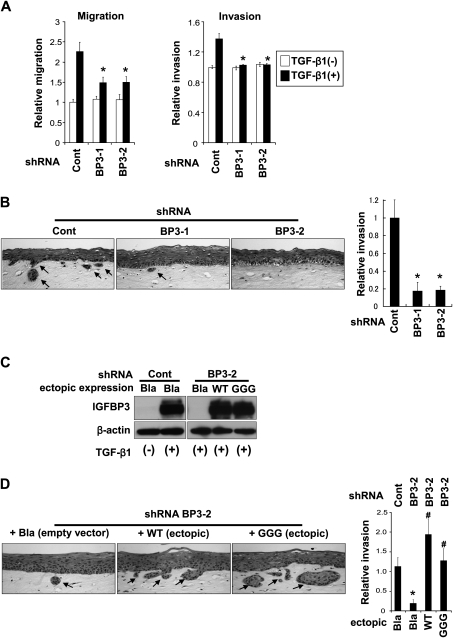
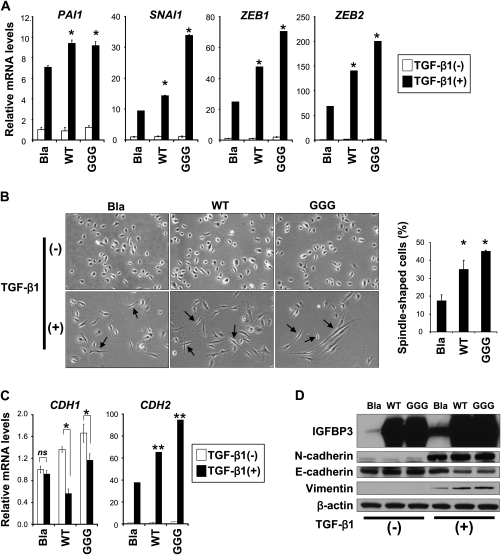
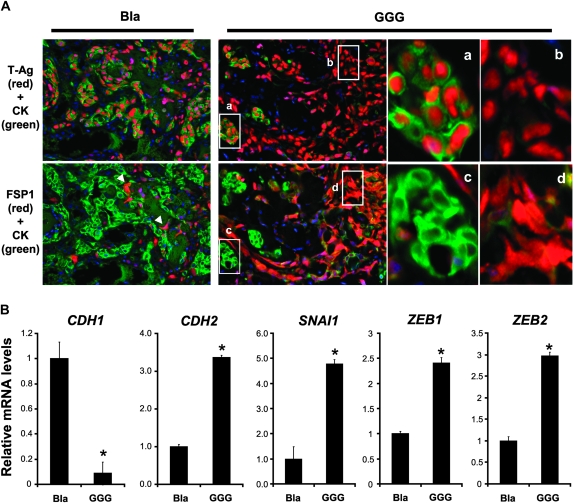
Insulin-like growth factor-binding protein (IGFBP)-3 is overexpressed frequently in esophageal squamous cell carcinoma. Yet, the role of IGFBP3 in esophageal tumor biology remains to be elucidated. We find that IGFBP3 facilitates transforming growth factor (TGF)-beta1-mediated epithelial-to-mesenchymal transition (EMT) in transformed human esophageal epithelial cells, EPC2-hTERT-EGFR-p53(R175H). In organotypic 3D culture, a form of human tissue engineering, laser-capture microdissection revealed concurrent upregulation of TGF-beta target genes, IGFBP3 and EMT-related genes in the cells invading into the stromal compartment. IGFBP3 enhanced TGF-beta1-mediated EMT as well as transcription factors essential in EMT by allowing persistent SMAD2 and SMAD3 phosphorylation. TGF-beta1-mediated EMT and cell invasion were enhanced by ectopically expressed IGFBP3 and suppressed by RNA interference directed against IGFBP3. The IGFBP3 knockdown effect was rescued by IGFBP3(I56G/L80G/L81G), a mutant IGFBP3 lacking an insulin-like growth factor (IGF)-binding capacity. Thus, IGFBP3 can regulate TGF-beta1-mediated EMT and cell invasion in an IGF or insulin-like growth factor 1 receptor-independent manner. IGFBP3(I56G/L80G/L81G) also promoted EMT in vivo in a Ras-transformed human esophageal cell line T-TeRas upon xenograft transplantation in nude mice. In aggregate, IGFBP3 may have a novel IGF-binding independent biological function in regulation of TGF-beta1-mediated EMT and cell invasion.


Figures

Fig. 1.
Fig. 1.
TGF-β induction of IGFBP3 in EMT-competent-transformed human esophageal cells is associated with induction of EMT-related genes in the engineered tissue microenvironment in organotypic 3D culture. Cells were stimulated with TGF-β1 for indicated time periods (AC). (A) IGFBP3 mRNA (upper panel) and protein (lower panel) were determined in EPC2–hTERT–EGFR–p53R175H cells by real-time reverse transcription–polymerase chain reaction and western blotting, respectively. In the upper panel, cells untreated with TGF-β1 served as a control. **P < 0.001 and *P < 0.05 versus TGF-β1 (−) at indicated time point (n = 3). (B) IGFBP3 mRNA levels were determined by real-time reverse transcription–polymerase chain reaction in either EMT-competent (EGFR-p53R175H) or EMT-incompetent (neo-puro) EPC2–hTERT cell derivative at indicated time point. **P < 0.001 and *P < 0.01 versus neo-puro (n = 3). (C) SMAD2/3 phosphorylation was determined in (B). pSmad2, phospho-Smad2 (Ser465/467) and pSmad3, phospho-Smad3 (Ser423/425). Diagrams (right panel) represent densitometry of the western blot (left panel). *P < 0.01 versus neo-puro; ns, not significant versus neo-puro (n = 3). (D) Relative mRNA for IGFBP3, TGF-β target and EMT-related genes was determined by real-time reverse transcription–polymerase chain reaction in the invasive EPC2–hTERT–EGFR–p53R175H cells comparing with the non-invasive EPC2–hTERT–EGFR–p53R175H cells isolated by LCM as shown in supplementary Figure 2B, available at Carcinogenesis Online. **P < 0.001; *P < 0.01; ns, not significant versus non-invasive (n = 3).
Fig. 2.
Fig. 2.
IGFBP3 knockdown suppresses TGF-β signaling in EPC2–hTERT–EGFR–p53R175H cells. Cells were transduced stably with shRNA directed against IGFBP3 (BP3-1 and BP3-2) or a scrambled control shRNA (Cont). Cells were stimulated with TGF-β1 for 14 days in (A) (right panel), (C) and (E) and for 48 h in (D), unless indicated otherwise. pSmad2, phospho-Smad2 and pSmad3, phospho-Smad3 in (B) and (C). (A) IGFBP3 mRNA (left) and protein (right) were determined by real-time reverse transcription–polymerase chain reaction upon IGFBP3 knockdown. **P < 0.01; *P < 0.05 versus Cont (n = 3). (B) SMAD2/3 phosphorylation in (A) was determined by western blotting. The relative phosphorylation levels for SMAD2 and SMAD3 (lower panel) represent densitometry of the western blots. *P < 0.01 versus Cont; ns, not significant versus Cont (n = 3). (C) Western blotting was done with or without TGF-β1 stimulation for 14 days to determine the long-term impact of IGFBP3 silencing upon SMAD2/3 expression and phosphorylation. Histograms represent the relative phosphorylation levels for SMAD2/3 (lower left panel) and total SMAD2/3 contents (lower right panel) determined by densitometry of the western blots. *P < 0.01 versus Cont with TGF-β1 (+) (n = 3). (D) TGF-β reporter activity was determined by luciferase assays with 3TP-Lux. Indicated reagents were added 5 h after transfection. rhBP3, rhIGFBP3; *P < 0.05 versus TGF-β1 (+) and rhBP3 (−) in Cont; #P < 0.05 versus TGF-β1 (+) and rhBP3 (−) in BP3-2 (n = 6). (E) plasminogen activator inhibitor type 1 mRNA was determined by real-time reverse transcription–polymerase chain reaction. *P < 0.01 versus TGF-β1 (+) in Cont (n = 3).
Fig. 3.
Fig. 3.
IGFBP3 knockdown delays TGF-β-mediated EMT in EPC2–hTERT–EGFR–p53R175H cells. Cells expressing shRNA directed against IGFBP3 (BP3-1 and BP3-2) or a scrambled control shRNA (Cont) were stimulated with TGF-β1 for 14 days in (A), (B, left panel), (C) and (D), unless indicated otherwise. (A) mRNA for SNAI1, ZEB1 and ZEB2 was determined by real-time reverse transcription–polymerase chain reaction. *P < 0.01 versus Cont plus TGF-β1 (+) (n = 3). (B) Phase contrast photomicrograph was taken (left). Arrows indicate spindle-shaped cells suggesting EMT as described previously (25); magnification, ×200. Spindle-shaped cells were scored at the indicated time points (right). *P < 0.05 versus Cont (n = 6). (C) mRNA for E-cadherin (CDH1) and N-cadherin (CDH2) was determined by real-time reverse transcription–polymerase chain reaction. #P < 0.01 TGF-β1 (−); ns, not significant versus TGF-β1 (−); *P < 0.01 TGF-β1 (+) (n = 3). (D) E-cadherin (E-cad.) and N-cadherin (N-cad.) proteins were determined by western blotting.
Fig. 4.
Fig. 4.
IGFBP3 knockdown impaired EMT program to prevent cellular motility. EPC2–hTERT–EGFR–p53R175H cells expressing shRNA directed against IGFBP3 (BP3-1 and BP3-2) or a scrambled control shRNA (Cont) were subjected to Boyden chamber assays (A) or organotypic 3D culture (B and D). (A) Cells were stimulated with or without TGF-β1 for 14 days prior to the Boyden chamber assays. *P < 0.01 versus Cont plus TGF-β1 (+) (n = 3). (B) Cells were grown in organotypic 3D culture in the absence of exogenous TGF-β. Hematoxylin and eosin staining visualized the reconstituted stratified squamous epithelia and cells displaying downward invasive growth into the stromal compartment. The invasive area, indicated by arrows, was measured and represented as a histogram; magnification, ×200. *P < 0.01 versus Cont (n = 3). (C) Western blotting validates that IGFBP3 expression was restored by ectopic WT or GGG-mutant IGFBP3 in the cells expressing IGFBP3 shRNA. Note that empty vector (Bla) failed to antagonize the IGFBP3 shRNA effect. (D) Cells in (C) were grown in organotypic 3D culture and analyzed as in (B); magnification, ×200. *P < 0.01 versus Cont plus Bla; #P < 0.01 versus BP3-2 plus Bla (n = 3).
Fig. 5.
Fig. 5.
IGFBP3 overexpression stimulates TGF-β signaling to promote EMT and cell invasion. EPC2–hTERT–EGFR–p53R175H cells were stably transduced with WT or GGG-mutant IGFBP3 or an empty control vector (Bla). Cells were stimulated with or without TGF-β1 for 7 days in (A–D). (A) mRNA for indicated genes was determined by real-time reverse transcription–polymerase chain reaction. *P < 0.01 versus Bla plus TGF-β1 (+) (n = 3). (B) Phase contrast photomicrograph was taken. Arrows indicate spindle-shaped cells suggesting EMT; magnification, ×200. Spindle-shaped cells were scored. *P < 0.01 versus Bla (n = 6). (C) mRNAs for CDH1 and CDH2 was determined by real-time reverse transcription–polymerase chain reaction. ns, not significant versus Bla plus TGF-β1 (−); *P < 0.05 versus Bla plus TGF-β1 (−); **P < 0.01 versus Bla plus TGF-β1 (+) (n = 3). (D) Western blotting determines IGFBP3 and EMT marker proteins.
Fig. 6.
Fig. 6.
IGFBP3 overexpression promotes EMT in xenografted esophageal tumors. T-TeRas tumors stably expressing GGG-mutant IGFBP3 or an empty control vector (Bla) were harvested at 3 weeks after subcutaneous injection into nude mice. Cells expressing WT IGFBP3, failing to form tumors due to massive apoptosis as described previously (14), was excluded from the analysis. (A) Tumor tissues were stained by immunofluorescence for CK (green) along with either T-Ag (red) or FSP1 (red). Note that the tumor tissues contain CK bright [demarcated area was enlarged in (a) and (c)] and CK dim or negative cells [arrow heads and enlarged in (b) and (d)]. Nuclear T-Ag was detected in both CK bright and dim or negative cells, but not in host-derived stromal cells stained blue only by 4′,6-diamidino-2-phenylindole. (B) mRNA for indicated genes was determined by real-time reverse transcription–polymerase chain reaction in the tumors. *P < 0.01 versus Bla (n = 3).

Similar articles

Cited by

References

    1. Enzinger PC, et al. Esophageal cancer. N. Engl. J. Med. 2003;349:2241–2252. - PubMed
    1. Nakagawa H, et al. Biology of esophageal cancer. In: Rustgi AK, editor. Gastrointestinal Cancers. London: Elsevier; 2003. pp. 241–251.
    1. Itakura Y, et al. Epidermal growth factor receptor overexpression in esophageal carcinoma. An immunohistochemical study correlated with clinicopathologic findings and DNA amplification. Cancer. 1994;74:795–804. - PubMed
    1. Parenti AR, et al. p53 overexpression in the multistep process of esophageal carcinogenesis. Am. J. Surg. Pathol. 1995;19:1418–1422. - PubMed
    1. Volant A, et al. p53 protein accumulation in oesophageal squamous cell carcinomas and precancerous lesions. J. Clin. Pathol. 1995;48:531–534. - PMC - PubMed

Publication types

MeSH terms

Substances