. 2010 Jul 12;365(1549):2081-91.
doi: 10.1098/rstb.2010.0011.

Predicting the effects of temperature on food web connectance

Affiliations

Predicting the effects of temperature on food web connectance

Owen L Petchey et al. Philos Trans R Soc Lond B Biol Sci. .

Abstract

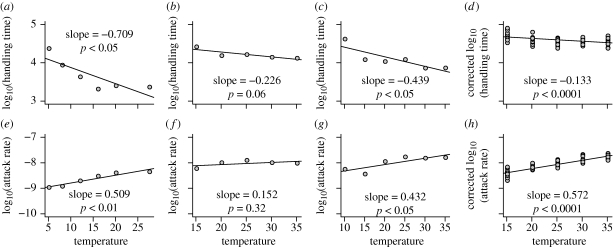
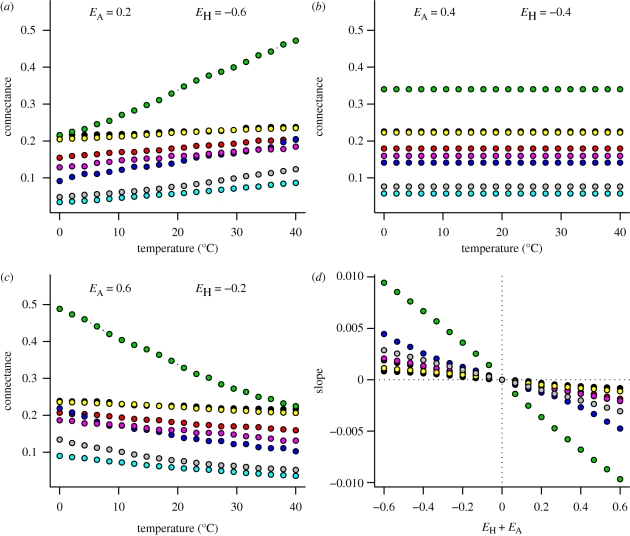
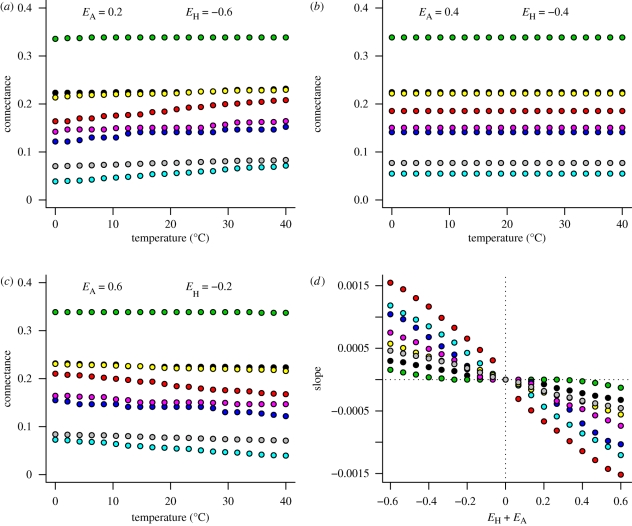
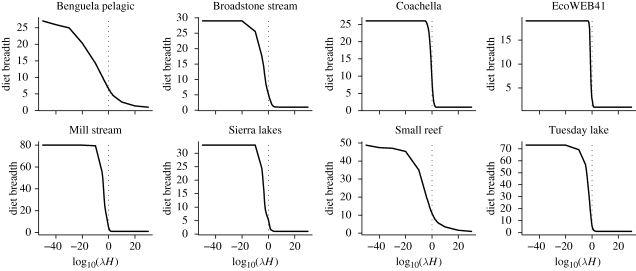
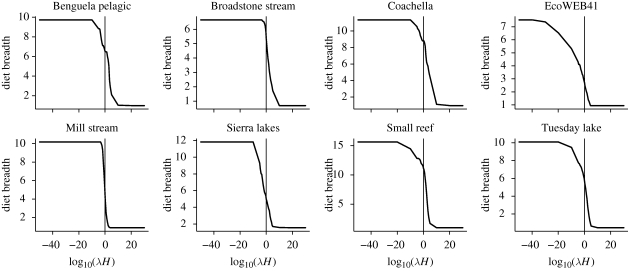
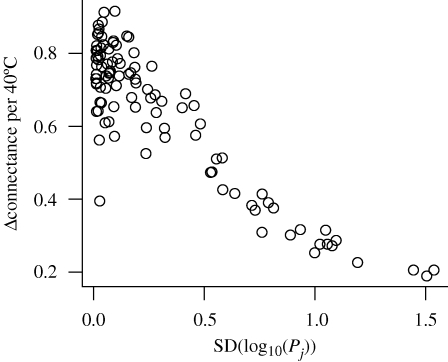
Few models concern how environmental variables such as temperature affect community structure. Here, we develop a model of how temperature affects food web connectance, a powerful driver of population dynamics and community structure. We use the Arrhenius equation to add temperature dependence of foraging traits to an existing model of food web structure. The model predicts potentially large temperature effects on connectance. Temperature-sensitive food webs exhibit slopes of up to 0.01 units of connectance per 1 degrees C change in temperature. This corresponds to changes in diet breadth of one resource item per 2 degrees C (assuming a food web containing 50 species). Less sensitive food webs exhibit slopes down to 0.0005, which corresponds to about one resource item per 40 degrees C. Relative sizes of the activation energies of attack rate and handling time determine whether warming increases or decreases connectance. Differences in temperature sensitivity are explained by differences between empirical food webs in the body size distributions of organisms. We conclude that models of temperature effects on community structure and dynamics urgently require considerable development, and also more and better empirical data to parameterize and test them.


Figures

Figure 1.
Figure 1.
(ad) Empirical relationships between temperature and handling times and (eh) attack rate and temperature from four published studies. The data are plotted on log10 y-axis for clarity, while statistics and the slopes are calculated on natural log data with models equivalent to those in equations (2.2) and (2.4). (a,e) Thompson (1978), (b,f) Zhang et al. (1998), (c,g) Zhang et al. (1999) and (d,h) Xia et al. (2003). In (d,h) the y-axis variables are corrected to account for variation in prey and predator size among the data. In each plot the activation energy is given as the slope and the significance by the p-value.
Figure 2.
Figure 2.
Effects of temperature on food web connectance for different values of activation energies of attack rates (EA) and handling times (EH), using the power handling time function. Colours refer to different sets of parameter values that correspond to models fitted to eight food webs in Petchey et al. (2008). In (d) the x-axis represents the imbalance between effects of temperature on attack rates and handling times; the y-axis represents the slope of the temperature–connectance relationship. Black, Benguela Pelagic; red, Broadstone stream; green, Coachella; dark blue, EcoWEB41; light blue, Mill stream; pink, Sierra lakes; yellow, Small Reef; grey, Tuesday lake.
Figure 3.
Figure 3.
Effects of temperature on food web connectance for different values of activation energies of attack rates (EA) and handling times (EH), using the ratio handling time function. Colours refer to different sets of parameter values that correspond to models fitted to eight food webs in Petchey et al. (2008). In (d) the x-axis represents the imbalance between effects of temperature on attack rates and handling times; the y-axis represents the slope of the temperature–connectance relationship. Black, Benguela Pelagic; red, Broadstone stream; green, Coachella; dark blue, EcoWEB41; light blue, Mill stream; pink, Sierra lakes; yellow, Small Reef; grey, Tuesday lake.
Figure 4.
Figure 4.
Sensitivity of diet breadth in eight food webs to changes in the product of attack rates and handling times (power handling time function). The x-axis is an arbitrary multiplier applied to aT0 to create variation in λH. The value of λH equivalent to 20°C is shown at x value of zero (vertical dotted line). The gradient of the solid line where it crosses the dotted line is the sensitivity of diet breadth to temperature change at 20°C. These gradients match the relative sensitivities shown in figure 2d.
Figure 5.
Figure 5.
Sensitivity of diet breadth in eight food webs to changes in the product of attack rates and handling times (ratio handling time function). The x-axis is an arbitrary multiplier applied to aT0 to create variation in λH. The value of λH equivalent to 20°C is shown at x value of zero (vertical dotted line). The gradient of the solid line where it crosses the dotted line is the sensitivity of diet breadth to temperature change at 20°C. These gradients match the relative sensitivities shown in figure 3d.
Figure 6.
Figure 6.
Sensitivity of diet breadth depends on the magnitude of differences in profitability. Sensitivity is measured as change in connectance (Δconnectance) per 40°C. Differences in profitability are measured as the standard deviation of log10 profitabilities.

References

    1. Allen A. P., Gillooly J. F., Brown J. H.2005Linking the global carbon cycle to individual metabolism. Funct. Ecol. 19, 202–213 (doi:10.1111/j.1365-2435.2005.00952.x) - DOI
    1. Anderson K. J., Allen A. P., Gillooly J. F., Brown J. H.2006Temperature-dependence of biomass accumulation rates during secondary succession. Ecol. Lett. 9, 673–682 (doi:10.1111/j.1461-0248.2006.00914.x) - DOI - PubMed
    1. Apple J., del Giorgi P., Kemp W.2006Temperature regulation of bacterial production, respiration, and growth efficiency in a temperate salt-marsh estuary. Aquat. Microb. Ecol. 43, 243–254 (doi:10.3354/ame043243) - DOI
    1. Arft A. M., et al. 1999Responses of tundra plants to experimental warming: meta-analysis of the international tundra experiment. Ecol. Monogr. 69, 491–511
    1. Arim M., Bozinovic F., Marquet P. A.2007On the relationship between trophic position, body mass and temperature: reformulating the energy limitation hypothesis. Oikos 116, 1524–1530 (doi:10.1111/j.0030-1299.2007.15768.x) - DOI

Publication types

LinkOut - more resources