

Warming effects on marine microbial food web processes: how far can we go when it comes to predictions?
- PMID: 20513721
- PMCID: PMC2880134
- DOI: 10.1098/rstb.2010.0045
Warming effects on marine microbial food web processes: how far can we go when it comes to predictions?
Abstract
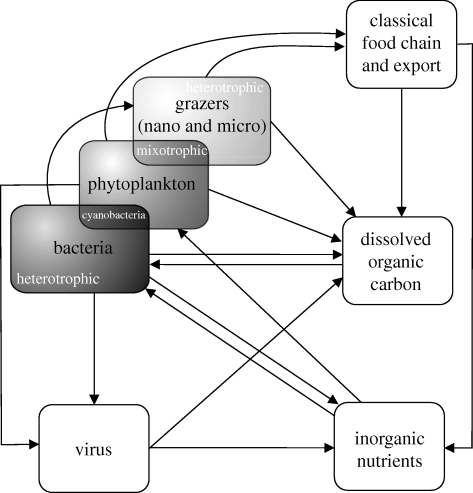
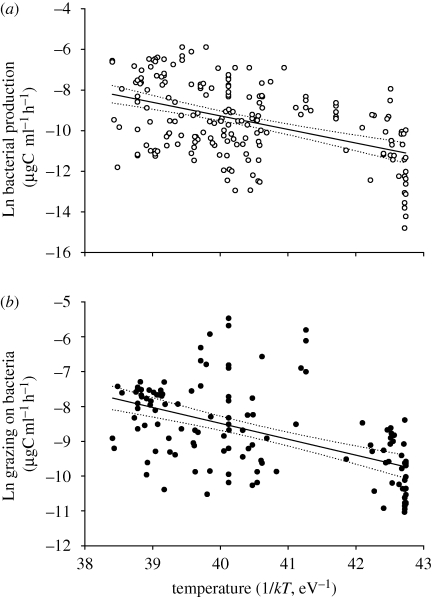
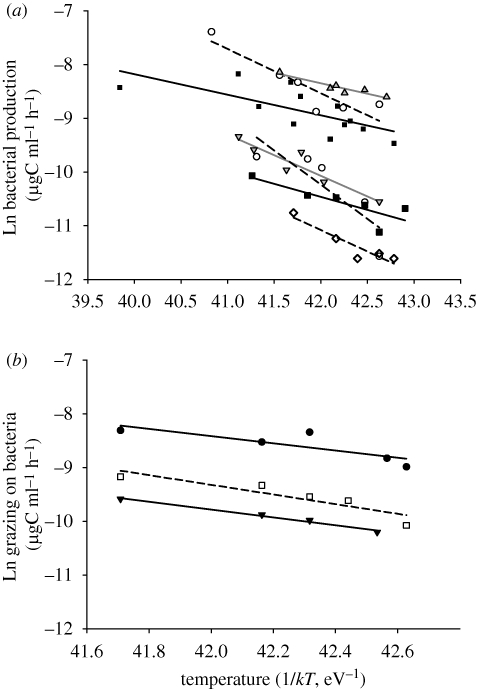
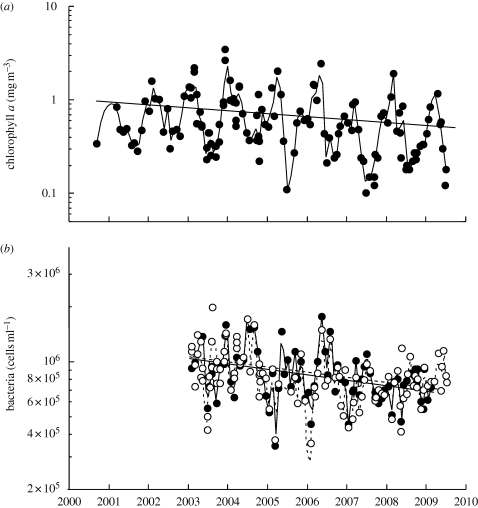
Previsions of a warmer ocean as a consequence of climatic change point to a 2-6 degrees C temperature rise during this century in surface oceanic waters. Heterotrophic bacteria occupy the central position of the marine microbial food web, and their metabolic activity and interactions with other compartments within the web are regulated by temperature. In particular, key ecosystem processes like bacterial production (BP), respiration (BR), growth efficiency and bacterial-grazer trophic interactions are likely to change in a warmer ocean. Different approaches can be used to predict these changes. Here we combine evidence of the effects of temperature on these processes and interactions coming from laboratory experiments, space-for-time substitutions, long-term data from microbial observatories and theoretical predictions. Some of the evidence we gathered shows opposite trends to warming depending on the spatio-temporal scale of observation, and the complexity of the system under study. In particular, we show that warming (i) increases BR, (ii) increases bacterial losses to their grazers, and thus bacterial-grazer biomass flux within the microbial food web, (iii) increases BP if enough resources are available (as labile organic matter derived from phytoplankton excretion or lysis), and (iv) increases bacterial losses to grazing at lower rates than BP, and hence decreasing the proportion of production removed by grazers. As a consequence, bacterial abundance would also increase and reinforce the already dominant role of microbes in the carbon cycle of a warmer ocean.
Figures
References
-
- Allen A. P., Gillooly J. F., Brown J. H.2005Linking the global carbon cycle to individual metabolism. Funct. Ecol. 19, 202–213 (doi:10.1111/j.1365-2435.2005.00952.x) - DOI
-
- Alonso-Sáez L., et al. 2008Factors controlling the year-round variability in carbon flux through bacteria in a coastal marine system. Ecosystems 11, 397–409 (doi:10.1007/s10021-008-9129-0) - DOI
-
- Aota Y., Nakajima H.2001Mutualistic relationships between phytoplankton and bacteria caused by carbon excretion from phytoplankton. Ecol. Res. 16, 289–299 (doi:10.1046/j.1440-1703.2001.00396.x) - DOI
-
- Behrenfeld M. J., et al. 2006Climate-driven trends in contemporary ocean productivity. Nature 444, 752–755 (doi:10.1038/nature05317) - DOI - PubMed
-
- Bernacchi C. J., Singsaas E. L., Pimentel C., Portis A. R., Long S. P.2001Improved temperature response functions for models of Rubisco-limited photosynthesis. Plant Cell Environ. 24, 253–259 (doi:10.1111/j.1365-3040.2001.00668.x) - DOI
Publication types
MeSH terms
LinkOut - more resources
Full Text Sources
Medical
Research Materials