. 2010 Jun 7;207(6):1145-52.
doi: 10.1084/jem.20091245. Epub 2010 May 31.

Activating WASP mutations associated with X-linked neutropenia result in enhanced actin polymerization, altered cytoskeletal responses, and genomic instability in lymphocytes

Affiliations

Activating WASP mutations associated with X-linked neutropenia result in enhanced actin polymerization, altered cytoskeletal responses, and genomic instability in lymphocytes

Lisa S Westerberg et al. J Exp Med. .

Abstract

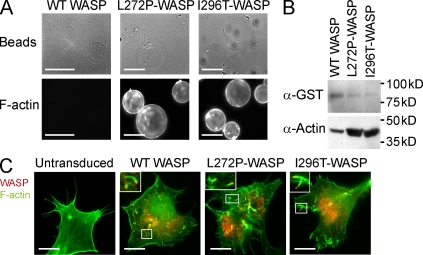
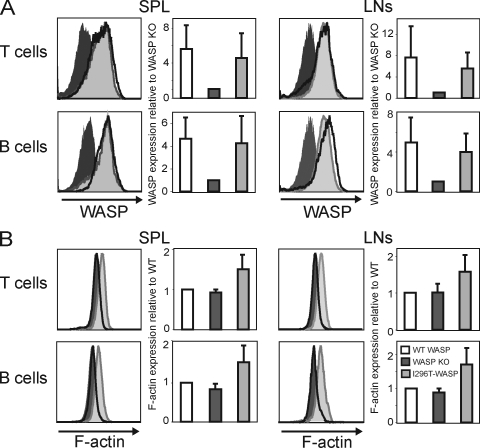
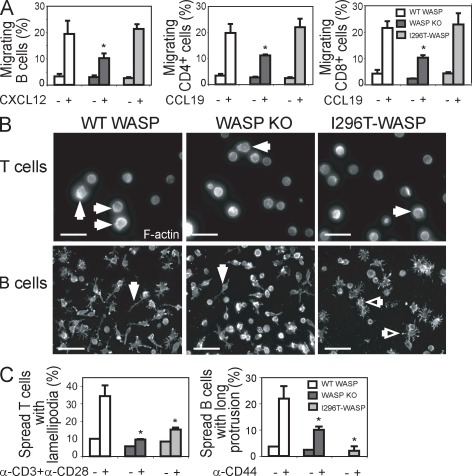
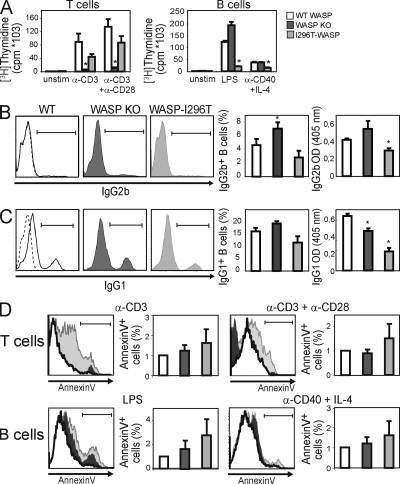
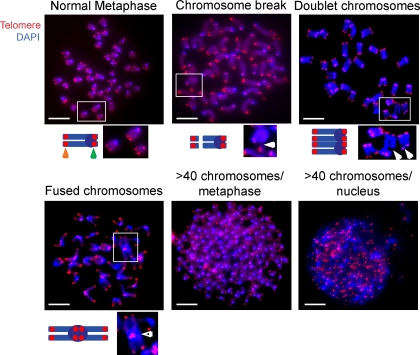
X-linked neutropenia (XLN) is caused by activating mutations in the Wiskott-Aldrich syndrome protein (WASP) that result in aberrant autoinhibition. Although patients with XLN appear to have only defects in myeloid lineages, we hypothesized that activating mutations of WASP are likely to affect the immune system more broadly. We generated mouse models to assess the role of activating WASP mutations associated with XLN (XLN-WASP) in lymphocytes. XLN-WASP is expressed stably in B and T cells and induces a marked increase in polymerized actin. XLN-WASP-expressing B and T cells migrate toward chemokines but fail to adhere normally. In marked contrast to WASP-deficient cells, XLN-WASP-expressing T cells proliferate normally in response to cell-surface receptor activation. However, XLN-WASP-expressing B cells fail to proliferate and secrete lower amounts of antibodies. Moreover, XLN-WASP expression in lymphocytes results in modestly increased apoptosis associated with increased genomic instability. These data indicate that there are unique requirements for the presence and activation status of WASP in B and T cells and that WASP-activating mutations interfere with lymphocyte cell survival and genomic stability.


Figures

Figure 1.
Figure 1.
WASP-L272P and WASP-I296T induce increased actin polymerization in vitro, and are stably expressed and functional in live cells. (A and B) In vitro actin-polymerizing assay. GST-WASP fusion proteins were purified with glutathione sepharose beads and incubated with cell lysates to induce actin polymerization. Polymerized actin (F-actin) was visualized on beads after labeling with phalloidin (A) or by Western blotting using anti-actin antibodies (B). Bars, 100 µm. (C) Expression of WASP and rescue of vaccinia actin tail formation. Retrovirions expressing WASP-WT, WASP-L272P, and WASP-I296T with an N-terminal flag tag were used for protein expression in N-WASP–deficient fibroblasts. The cells were subsequently infected with vaccinia virus that forms characteristic actin tails visualized with phalloidin (green). Localization of WASP proteins was determined using anti-flag antibodies (red). Vaccinia fails to form tails in untransduced N-WASP–deficient fibroblasts (left). Insets show higher magnification of boxed areas highlighting vaccinia virus actin tails. Bars, 20 µm. These experiments represent one of at least three independent experiments.
Figure 2.
Figure 2.
WASP-I296T and WASP-L272P are expressed in B and T cells and induce marked increase in polymerized actin. (A) WASP expression. Spleen and lymph node T and B cells were stained for WASP using an anti-WASP antibody followed by flow cytometric analysis. (B) Polymerized actin (F-actin) content. Spleen and lymph node T and B cells were stained with phalloidin to detect F-actin and analyzed by flow cytometry. Each panel shows one representative histogram (left) and one graph (right) of mean values (±SD) of six experiments (n = 6; A) and five experiments (n = 5; B).
Figure 3.
Figure 3.
Normal migratory response but reduced spreading of WASP-L272P and WASP-I296T B and T cells. (A) Migration. Spleen B or T cells were allowed to migrate to CXCL12 or CCL19 for 3 h using an in vitro chemotaxis chamber. Migrating cells were collected and enumerated by flow cytometry with reference beads. The percentage of migrating cells is shown as mean values (±SD) of triplicate wells and is representative of at least three experiments. *, P < 0.05 compared with WT. (B) Spreading. (top) Spreading of T cells was assessed on anti-CD3 plus anti-CD28 antibody–coated surfaces. Closed white arrows depict the formation of large sheet-like lamellipodia of spread T cells. Bars, 25 µm. (bottom) Spreading of activated B cells was assessed on anti-CD44 antibody–coated surfaces. Closed white arrows depict the formation of long protrusions of spread B cells and open white arrows depict spread cells with many short protrusions. Bars, 40 µm. (C) Graphs show the mean of relative numbers (±SD) of spread T (left) and B cells (right) in triplicates and are representative of three experiments. *, P < 0.05 compared with WT.
Figure 4.
Figure 4.
WASP-I296T reduces the proliferative response of B cells, but not T cells, and leads to modestly increased apoptosis. (A) Proliferation. Spleen T (left) and B cells (right) were stimulated for 48 h with the indicated stimulus followed by a 16-h pulse with [3H]thymidine to determine the proliferative response. Bars are representative mean values of cpm ([3H]thymidine) ± SD of triplicate wells from one of at least three independent experiments. *, P < 0.05 compared with WT. (B and C) Spleen B cells were stimulated with LPS (B) and anti-CD40 plus IL-4 (C) for 96 h and assessed for IgG2b (B) and IgG1 (C) class switching by intracellular staining and antibody secretion by ELISA. Each panel shows one representative histogram (left) and one graph of mean values (±SD) of three different mice (middle). The dashed lines in the WT histograms (left) indicate the isotype control. Graphs (right) show secretion of IgG2b (B) and IgG1 (C) by ELISA. Each graph represents mean values (±SD) of three different mice. B and C represent one out of two similar experiments. *, P < 0.05 compared with WT. (D) Apoptosis. Spleen T and B cells were stimulated with the indicated stimulus for 72 h. The percentage of apoptotic cells was assessed after labeling with 7AAD and annexin V and flow cytometric analysis. Apoptotic cells were defined as annexin Vhigh7AADlo. Each panel shows one representative histogram (left) and one graph of mean values (±SD) of three or more experiments (right). In each case, although there were statistically significant differences (P < 0.05) in apoptosis between WASP-I296T cells when compared with WASP-WT in most individual experiments, because of the variability, statistical significance was not met when compiling all experiments.
Figure 5.
Figure 5.
Increased genomic instability in WASP-I296T B and T cells. (A) Examples of cytogenetic abnormalities observed in WASP-I296T B and T cells. DAPI-stained chromosomes are blue, with the centromeres being visualized as more intense blue ovals. Red dots come from telomere signals. The top left micrograph depicts a normal metaphase with 40 chromosomes, each consisting of two sister chromatids and four telomeres. The schematic drawing represents one chromsome with two sister chromatids. The orange arrow denotes telomeres at the long arms and the green arrow denotes telomeres on the short arms of the chromatids. Insets show higher magnification of boxed areas to highlight normal and altered chromosomes. The other micrographs depict representative chromosomal abnormalities including chromosomal breaks (top middle micrograph), doublet chromosomes with breaks (top right micrograph), a fused chromosome (bottom left micrograph), a metaphase with >40 chromosomes (bottom middle micrograph), and a nucleus with >40 chromosomes, i.e., >160 telomeres (bottom right micrograph). Closed white arrowheads in the magnified images beneath the micrographs denote chromosomal breaks. The open white arrowhead denotes two fused chromosomes with a large centromere. Bars, 2 µm.

References

    1. Adamovich D.A., Nakamura F., Worth A., Burns S., Thrasher A.J., Hartwig J.H., Snapper S.B. 2009. Activating mutations of N-WASP alter Shigella pathogenesis. Biochem. Biophys. Res. Commun. 384:284–289 10.1016/j.bbrc.2009.04.050 - DOI - PMC - PubMed
    1. Ancliff P.J. 2003. Congenital neutropenia. Blood Rev. 17:209–216 10.1016/S0268-960X(03)00019-5 - DOI - PubMed
    1. Ancliff P.J., Blundell M.P., Cory G.O., Calle Y., Worth A., Kempski H., Burns S., Jones G.E., Sinclair J., Kinnon C., et al. 2006. Two novel activating mutations in the Wiskott-Aldrich syndrome protein result in congenital neutropenia. Blood. 108:2182–2189 10.1182/blood-2006-01-010249 - DOI - PubMed
    1. Batista F.D., Harwood N.E. 2009. The who, how and where of antigen presentation to B cells. Nat. Rev. Immunol. 9:15–27 10.1038/nri2454 - DOI - PubMed
    1. Beel K., Cotter M.M., Blatny J., Bond J., Lucas G., Green F., Vanduppen V., Leung D.W., Rooney S., Smith O.P., et al. 2009. A large kindred with X-linked neutropenia with an I294T mutation of the Wiskott-Aldrich syndrome gene. Br. J. Haematol. 144:120–126 10.1111/j.1365-2141.2008.07416.x - DOI - PMC - PubMed

Publication types

MeSH terms