. 2010 Jun 7;207(6):1333-43.
doi: 10.1084/jem.20091193. Epub 2010 May 31.

Innate immunity defines the capacity of antiviral T cells to limit persistent infection

Affiliations

Innate immunity defines the capacity of antiviral T cells to limit persistent infection

Daniel M Andrews et al. J Exp Med. .

Abstract

Effective immunity requires the coordinated activation of innate and adaptive immune responses. Natural killer (NK) cells are central innate immune effectors, but can also affect the generation of acquired immune responses to viruses and malignancies. How NK cells influence the efficacy of adaptive immunity, however, is poorly understood. Here, we show that NK cells negatively regulate the duration and effectiveness of virus-specific CD4+ and CD8+ T cell responses by limiting exposure of T cells to infected antigen-presenting cells. This impacts the quality of T cell responses and the ability to limit viral persistence. Our studies provide unexpected insights into novel interplays between innate and adaptive immune effectors, and define the critical requirements for efficient control of viral persistence.


Figures
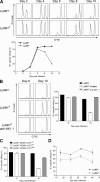
Figure 1.
Figure 1.
NK cells affect antiviral CTL function. Ly49H and Ly49H+ mice were infected with MCMV (5 × 10³ PFU K181-Perth). (A) Virus-specific CTL activity was assessed in vivo at days 2, 4, 6, 8, and 10 pi by measuring the elimination of adoptively transferred CFSE low targets pulsed with the IE1 viral peptide. Unpulsed (CFSE high) targets are used for comparison. The histograms represent the number of CFSE high (unpulsed) and CFSE low (IE1 pulsed) targets in the spleens of relevant mice. The data are representative of at least two experiments each using three mice per time point. (bottom) CTL data are shown as percentage of IE1-specific cytotoxicity determined as described in the Materials and methods section. Arithmetic means and standard errors were plotted using the results from two independent experiments each using three mice per time-point. (B) Ly49H, Ly49H+ isotype-matched control Ig-treated mice, and Ly49H+ anti-NK1.1–treated mice were infected with MCMV (5 × 10³ PFU). Virus-specific CTL activity was measured in vivo at days 6 and 10 pi. Data are representative of at least five independent experiments each using three mice per time point. (right) CTL data are shown as percentage of IE1-specific cytotoxicity. Arithmetic means and standard errors were plotted using the results from two independent experiments each using three mice per time point. (C) Ly49H+ mice were infected with wild-type MCMV (MCMV-m157wt) or a mutant MCMV virus with a nonfunctional m157 glycoprotein (MCMV-m157mut). CTL data are plotted as percentage of IE1-specific cytotoxicity. CTL data from Ly49H mice infected with wild-type MCMV are shown for comparison. Arithmetic means and standard errors are plotted. The data are representative of at least three independent experiments each with at least three mice per group (D) Virus-specific CTL activity was measured at days 18, 25, 32, and 40 after infection in ▪ (Ly49H) and □ (Ly49H+) mice. Data are representative of two independent experiments each using 3 mice per group. Arithmetic means and standard errors are plotted. The differences were significant at all times. P < 0.0005. Experiments described in A–C were performed in BALB/c (Ly49H) and BALB.B6-Cmv1r (Ly49H+) mice. Experiments described in D were performed in BALB/c (Ly49H) and BALB.B6-CT8 (Ly49H+) mice.
Figure 2.
Figure 2.
Differences in CD8+ T cells from Ly49H and Ly49H+ mice. Ly49H and Ly49H+ mice were infected with 5 × 10³ PFU MCMV and splenocytes harvested at day 6 and 10 pi. (A) Expression of CD69 was assessed on live TCR+CD8+IE1-tetramer+ cells. The frequency of CD69+ CD8+IE1-tetramer+ cells is plotted. Frequencies are shown as arithmetic means with standard errors. The data are representative of two independent experiments each with three mice per group. (B) The frequencies of IFN-γ+TNF-α+ CD8+IE1+ cells are plotted. The data are representative of two independent experiments each with three mice per group. Frequencies are shown as arithmetic means with standard errors. Experiments were performed in BALB/c (Ly49H) and BALB.B6-CT8 (Ly49H+) mice.
Figure 3.
Figure 3.
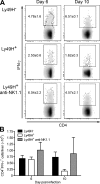
NK cells affect the frequency of activated CD4+IFN-γ+ T cells. Ly49H, Ly49H+, and Ly49H+ NK1.1-depleted mice were infected with MCMV (5 × 10³ PFU). (A) The frequencies of CD4+IFN-γ+ T cells in the liver at days 6 and 10 pi are shown. The frequencies of IFN-γ+ cells are shown as a percentage of TCR+CD4+ cells. Density plots are representative of results from three independent experiments using three mice per time point, except the NK depletion which was performed once. Frequencies of cells in each boxed region are shown as arithmetic means with standard errors. (B) The numbers of CD4+IFN-γ+ T cells in the liver at days 6 and 10 pi are shown as arithmetic means with standard errors. The experiments were performed in BALB/c (Ly49H) and BALB.B6-CT8 (Ly49H+) mice.
Figure 4.
Figure 4.
Sustained APC infection in Ly49H mice, but not in Ly49H+ mice. (A) Ly49H (BALB/c) and Ly49H+ (BALB.B6-CT8) mice were infected with 5 × 10³ PFU of MCMV-K181-LacZ, and the frequency of infected APCs in the spleen was measured 2, 4, and 6 d pi using FDG. Histograms represent the expression of FDG-LacZ in CD11c+ MHC-II+ cells from the spleen. The proportion of FDG+ cells was first corrected for background fluorescence by subtracting the FDG+ values measured in uninfected controls. Arithmetic means and standard errors are shown. Uninfected controls are shown as a solid black line. Infected mice are shown as gray-filled histograms. The frequencies of infected FDG+ cells are shown and represent data from three mice. The data are representative of two independent experiments. (B) The number of infected MHC-II+ APC in the spleens of MCMV infected mice at days 2, 4, and 6 d pi are shown. The numbers of infected MHC-II+ APC were determined using FDG after correction for background fluorescence. Arithmetic means and standard errors are shown. (C) Ly49H+ BALB.B6-Cmv1r and BALB.B6-Cmv1r.pfp−/− mice were infected with 5 × 10³ PFU of MCMV-K181-LacZ. Histograms represent the expression of FDG-LacZ in CD11c+ MHC-II+ cells purified from the spleen. Uninfected controls are shown as a solid black line. Infected mice (n = 3) are shown as gray filled histograms. The data are representative of 3 independent experiments.
Figure 5.
Figure 5.
More viral peptide–MHC complex available to T cells in Ly49H mice sustains ongoing T cell proliferation. Ly49H and Ly49H+ mice were infected with 5 × 10³ PFU of MCMV-K181-HA and APC populations enriched by density gradient and negative antibody enrichment on day 2, 4, and 6 pi. (A) The phenotype and frequency of the enriched populations is shown. Density plots (gated on live lymphocytes) depict the CD11c and Siglec H expression in Ly49H and Ly49H+ mice. (B) APCs were enriched from MCMV-K181-HA infected Ly49H and Ly49H+ mice, as shown in A, at day 0, 2, 4, and 6 pi, and incubated in vitro with CFSE-labeled Tg-HA CD8+ T cells for 5 d. Histograms show proliferation of CD8+ T cells (gated on live, TCR+, CD8+, and CD4). CD8+ T cells incubated with uninfected APCs are shown as gray-filled histograms. CD8+ T cells incubated with APC from 2, 4, and 6 d pi are shown as solid black lines. The frequencies of cells with diluting CFSE are shown. Data are representative of two independent experiments performed in triplicate. All experiments were performed in BALB.B6-CT6 (Ly49H) and BALB.B6-CT8 (Ly49H+) mice.
Figure 6.
Figure 6.
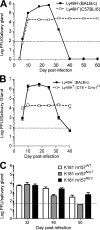
Viral persistence differs in Ly49H and Ly49H+ mice. (A) Titers of replicating virus in salivary glands of infected BALB/c and C57BL/6J mice are shown over a course of infection. Arithmetic means and standard errors are plotted. Data are combined results from at least three independent experiments each using three mice per time point. (B) Viral titers equivalent to those observed in C57BL/6 mice were obtained in Ly49H+ BALB/c congenic mice. Arithmetic means and standard errors are plotted. Each data point represents six mice (three BALB.B6-Cmv1r and three BALB.B6-CT8). Data from BALB.B6-Cmv1r and BALB.B6-CT8 were combined because both strains are identical in respect to MCMV growth characteristics in vivo. Day 32 and day 40, P = 0.0022 when comparing Ly49H with Ly49H+ mice. (C) Viral persistence in the salivary glands of Ly49H+ mice infected with a mutant virus lacking m157 is reduced, and is equivalent to that observed in Ly49H mice. Ly49H+ C57BL/6 mice were infected with wild-type virus (MCMV-m157WT) or a virus with a nonfunctional m157 glycoprotein (MCMV-m157MUT). A revertant virus (MCMV-m157REV), generated by inserting a functional m157 glycoprotein in the MCMV-m157MUT, was also used. Organs were collected at days 32, 40, and 50 pi. Titers of replicating virus in the salivary glands are shown as arithmetic means and standard errors. n = 7. Day 40, P = 0.0313 when comparing MCMV-m157MUT with MCMV-m157REV.
Figure 7.
Figure 7.
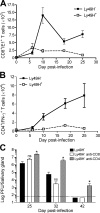
Viral persistence differs in Ly49H and Ly49H+ mice because of differences in CD4+ T cell responses. (A) Absolute numbers of CD8+IE1+ T cells from three mice and representative of four independent experiments and (B) absolute numbers of CD4+IFN-γ+ T cells from data pooled from five experiments (n = 15) at various times pi in the salivary glands of Ly49H and Ly49H+ mice infected with MCMV (5 × 10³ PFU). Absolute numbers are shown as arithmetic means and standard error. (C) Viral titers in the salivary glands of Ly49H mice depleted of either CD4+ or CD8+ T cells after infection with 104 PFU MCMV are shown. Titers in infected, undepleted Ly49H mice are shown for comparison. Arithmetic means and standard errors were plotted from one representative experiment with three mice per group and are representative results obtained in four independent experiments. *, P < 0.05. BALB/c (Ly49H) and BALB.B6-CT8 (Ly49H+) mice were used in the experiments described in A, except one where BALB.B6-CT6 (Ly49H) mice were used instead of BALB/c (Ly49H) mice. The experiments described in B were performed three times in BALB/c (Ly49H) and twice in BALB.B6-CT6 (Ly49H) in comparison with BALB.B6-CT8 (Ly49H+) mice. BALB/c (Ly49H) mice were used for all experiments described in C.

References

    1. Allan J.E., Shellam G.R. 1984. Genetic control of murine cytomegalovirus infection: virus titres in resistant and susceptible strains of mice. Arch. Virol. 81:139–150 10.1007/BF01309303 - DOI - PubMed
    1. Andoniou C.E., van Dommelen S.L., Voigt V., Andrews D.M., Brizard G., Asselin-Paturel C., Delale T., Stacey K.J., Trinchieri G., Degli-Esposti M.A. 2005. Interaction between conventional dendritic cells and natural killer cells is integral to the activation of effective antiviral immunity. Nat. Immunol. 6:1011–1019 10.1038/ni1244 - DOI - PubMed
    1. Andrews D.M., Andoniou C.E., Granucci F., Ricciardi-Castagnoli P., Degli-Esposti M.A. 2001. Infection of dendritic cells by murine cytomegalovirus induces functional paralysis. Nat. Immunol. 2:1077–1084 10.1038/ni724 - DOI - PubMed
    1. Andrews D.M., Scalzo A.A., Yokoyama W.M., Smyth M.J., Degli-Esposti M.A. 2003. Functional interactions between dendritic cells and NK cells during viral infection. Nat. Immunol. 4:175–181 10.1038/ni880 - DOI - PubMed
    1. Andrews D.M., Andoniou C.E., Fleming P., Smyth M.J., Degli-Esposti M.A. 2008. The early kinetics of cytomegalovirus-specific CD8+ T-cell responses are not affected by antigen load or the absence of perforin or gamma interferon. J. Virol. 82:4931–4937 10.1128/JVI.02127-07 - DOI - PMC - PubMed

Publication types

MeSH terms