. 2010 Jul 29;29(30):4261-75.
doi: 10.1038/onc.2010.197. Epub 2010 May 31.

Transgenic expression of 15-lipoxygenase 2 (15-LOX2) in mouse prostate leads to hyperplasia and cell senescence

Affiliations

Transgenic expression of 15-lipoxygenase 2 (15-LOX2) in mouse prostate leads to hyperplasia and cell senescence

M V Suraneni et al. Oncogene. .

Abstract

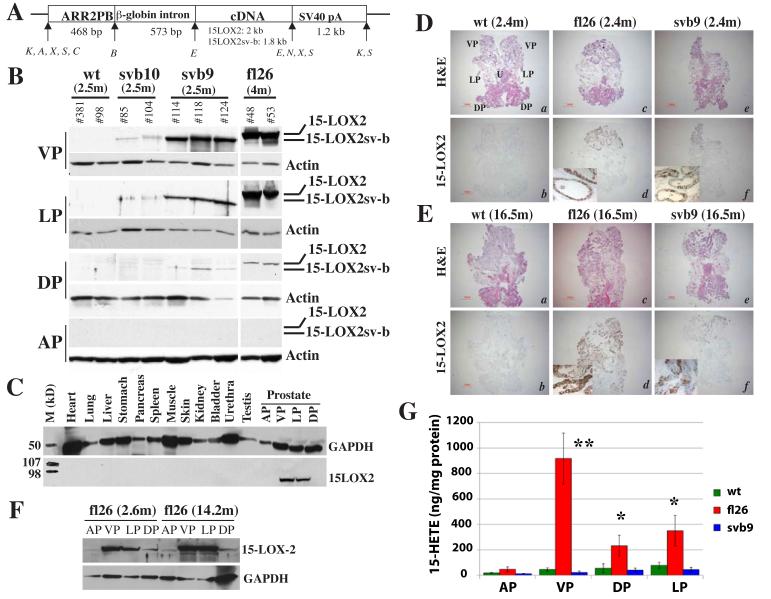
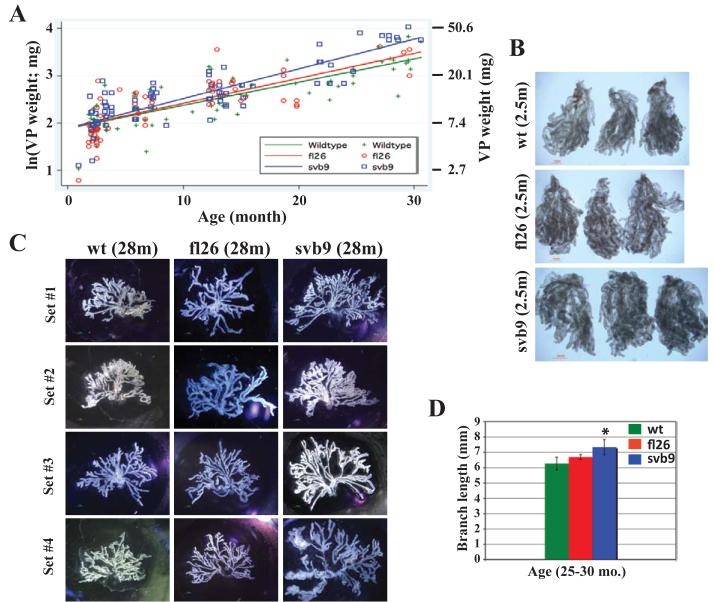
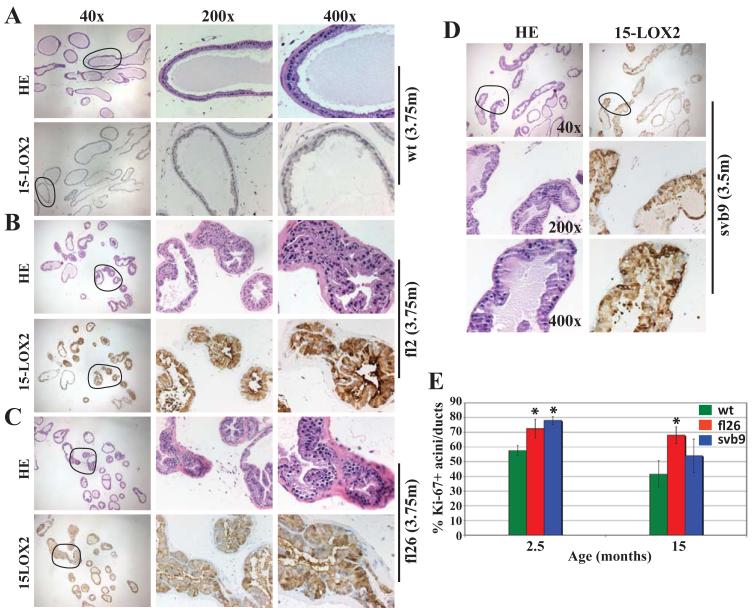
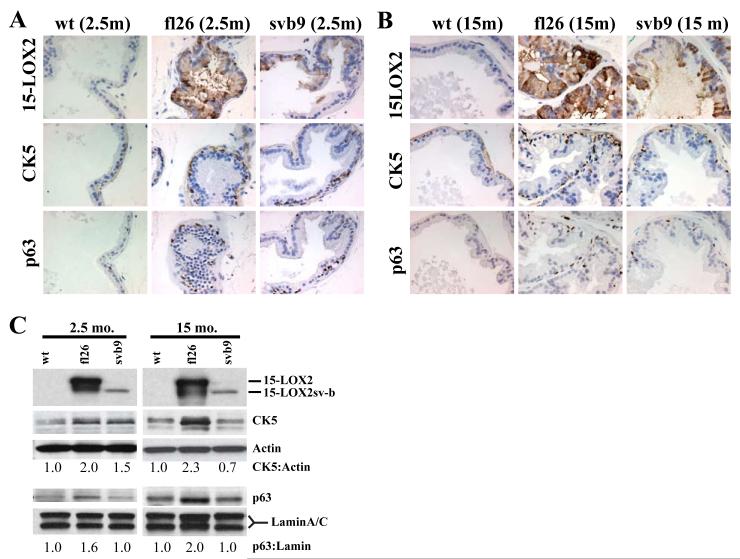
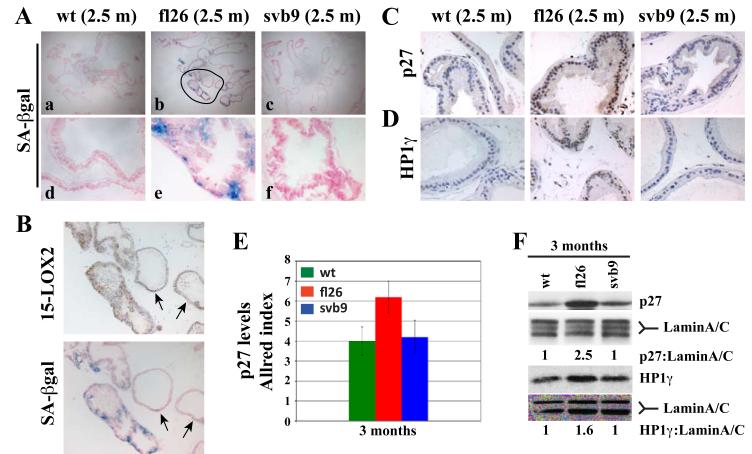
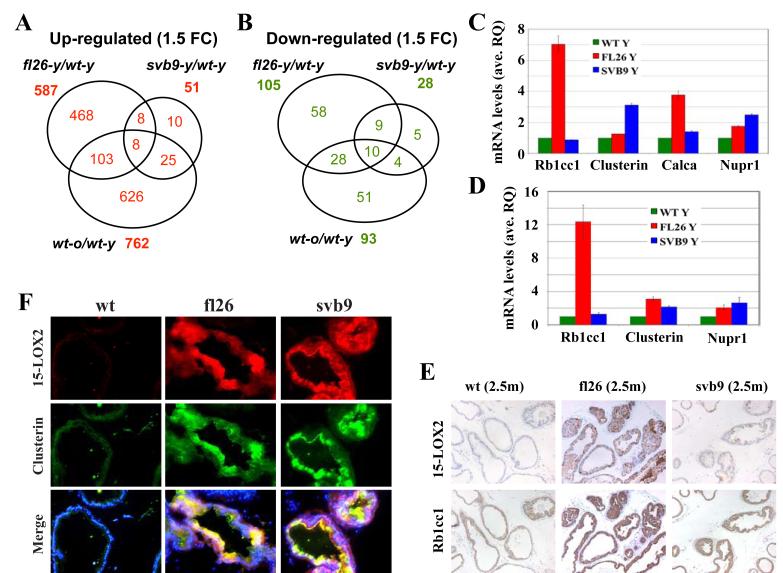
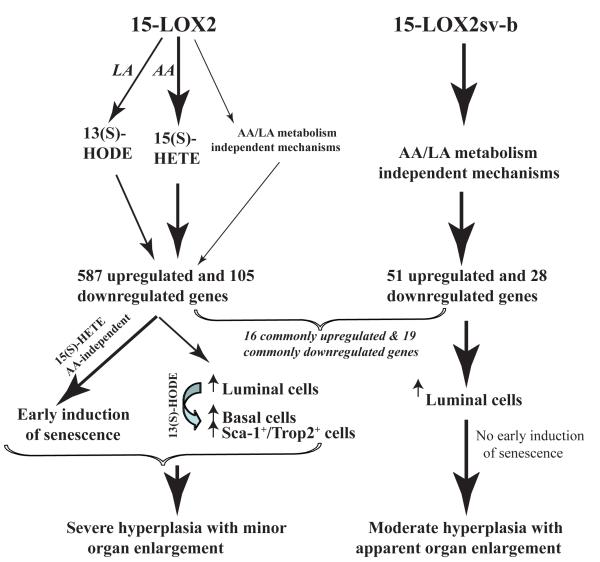
15-Lipoxygenase 2 (15-LOX2), a lipid-peroxidizing enzyme, is mainly expressed in the luminal compartment of the normal human prostate, and is often decreased or lost in prostate cancer. Previous studies from our lab implicate 15-LOX2 as a functional tumor suppressor. To better understand the biological role of 15-LOX2 in vivo, we generated prostate-specific 15-LOX2 transgenic mice using the ARR2PB promoter. Unexpectedly, transgenic expression of 15-LOX2 or 15-LOX2sv-b, a splice variant that lacks arachidonic acid-metabolizing activity, resulted in age-dependent prostatic hyperplasia and enlargement of the prostate. Prostatic hyperplasia induced by both 15-LOX2 and 15-LOX2sv-b was associated with an increase in luminal and Ki-67(+) cells; however, 15-LOX2-transgenic prostates also showed a prominent increase in basal cells. Microarray analysis revealed distinct gene expression profiles that could help explain the prostate phenotypes. Strikingly, 15-LOX2, but not 15-LOX2sv-b, transgenic prostate showed upregulation of several well-known stem or progenitor cell molecules including Sca-1, Trop2, p63, Nkx3.1 and Psca. Prostatic hyperplasia caused by both 15-LOX2 and 15-LOX2sv-b did not progress to prostatic intraprostate neoplasia or carcinoma and, mechanistically, prostate lobes (especially those of 15-LOX2 mice) showed a dramatic increase in senescent cells as revealed by increased SA-betagal, p27(Kip1) and heterochromatin protein 1gamma staining. Collectively, our results suggest that 15-LOX2 expression in mouse prostate leads to hyperplasia and also induces cell senescence, which may, in turn, function as a barrier to tumor development.


Figures

Figure 1
Figure 1. Generation and characterization of 15-LOX2 transgenic mice
(A) Schematic diagram of transgene constructs, which contain the ARR2PB promoter, rabbit β-globin second intron sequence, 15-LOX2 or 15-LOX2sv-b cDNA, and β-globin-SV40 hybrid polyA tail. The sizes (bp) of each module and restriction enzyme sites (K, Kpn I; A, Apa I; X, Xba I; S, Sal I; C, Cla I; B, BamH I, E, EcoR I; N, Nhe I) are indicated. (B) Prostatic lobes were dissected from animals of the indicated genotypes and ages (m, month), lysed in RIPA buffer and used in SDS-PAGE (50 μg lysate/lane). Immunoblotting was performed using the rabbit polyclonal anti-15LOX2, which recognizes most splice variants including 15-LOX2sv-b. The blots were stripped and reprobed for β-actin. (C) Prostate-specific transgene expression. Urogenital and other organs indicated were isolated from 2.5-month fl26 15-LOX2 transgenic mice and protein lysates (50 μg/lane) used in Western blotting for 15 LOX2 and GAPDH (loading control). (D-E) Transgene expression in young and old animals. Representative images of whole-mount prostate sections (without AP) made from 2.4 (D) or 16.5 (E) month (m) old wt, fl26 and svb9 mice (n>15/genotype), stained for HE or 15-LOX2. Images were taken with a Nikon stereomicroscope (Bar = 1 mm). The orientation of the whole-mount images was illustrated in D, panel a (U, urethra). (F) Transgene expression in young (2.5 month) and old (14.2 month) prostate lobes of fl26 mice. (G) 15(S)-HETE levels in wt and transgenic VPs measured in the presence of 50 μM AA. Bars represent the mean ± S.D of the measurements obtained from 5 animals/group. *p < 0.05 and **p < 0.01.
Figure 2
Figure 2. 15-LOX2 or 15-LOXsv-b expression results in enlargement of mouse prostates
(A) Graph showing wet VP weights (mg; right) or ln (weight) of wt (n = 91), fl26 (n = 68) and svb9 (n = 91) mice as a function of animal age. (B) Representative images (>5 for each genotype) of microdissected VP lobes of 2.5 month-old wt, fl26, svb9 mice showing increased prostate size in transgenic mice (scale bar = 1 mm). (C) Branching morphogenesis of representative VP lobes (4 for each genotype) microdissected from wt and transgenic mice depicting the differences in the length of branches and the complexity of branching pattern. (D) Branch lengths of the microdissected VPs from old (25 – 30 months) wt or transgenic animals (n = 5 per genotype). *P<0.05.
Figure 3
Figure 3. Transgenic VPs demonstrate epithelial hyperplasia
(A) H&E and 15-LOX2 staining of wt VPs. (B-D) The VPs of fl2 (B, highest expresser) and fl26 (C, high expresser) display prominent epithelial hyperplasia that correlated with transgene expression levels. The VPs of svb9 (D) also show epithelial hyperplasia. The ages in months (m) and the original magnifications of microphotographs are indicated. Circled areas in the 40x images are enlarged in the corresponding 200x and 400x images. (E) Ki-67+ acini/ducts as % of the total acini and ducts counted. Whole-mount VP sections stained for Ki-67 were used to quantify the acini and ducts that contained Ki-67+ cells [total numbers of acini/ducts counted: n = 168 for wt (15m), 202 for fl26 (15m), 215 for svb9 (15m), 196 for wt (2.5m), 189 for fl26 (2.5m), 195 for svb9 (2.5m)]. Data were collected from serial whole-mount sections of 3 VPs (* p<0.05).
Figure 4
Figure 4. Increased basal cells in the 15-LOX2 transgenic prostates
(A-B) Representative IHC images of serial tissue sections of 2.5 (A) and 15 (B) month-old wt and transgenic VPs stained for 15-LOX2, CK5, and p63. Original magnifications: x400. (C) Microdissected VPs were analyzed by immunoblotting for 15-LOX2, CK5 and p63. Actin was used as loading control for CK5 and lamin A/C was used as loading control for nuclear p63. The relative ratios of CK5:actin and p63:lamin were estimated by densitometry and by setting the corresponding wt values to 1.0.
Figure 5
Figure 5. Transgenic expression of 15-LOX2 leads to early induction of senescence
(A) Fresh whole-mount cryosections of wt and transgenic VPs at 2.5 mo. were stained for SA-βGal. Shown are images (40x, upper panels; 400x, lower panels) representative of 3-5 animals analyzed from each genotype/age group. (B) SA-βgal staining correlates with the transgene expression. The encircled area in fl26 (2.5m) in A was enlarged to show matched SA-βgal and 15-LOX2 staining. Note a good correlation between SA-βgal positivity and transgene expression. The two arrows indicate the glands that show weak staining for 15-LOX2 and correspondingly the lack of SA-βgal staining. (C-D) Whole-mount paraffin sections of wt and transgenic VPs at 2.5 mo. were used in IHC analysis of p27 (C) or HP1-γ (D). Representative images (400x) are presented. (E) Allred method determination of relative p27 levels (as Allred index) in the VPs of wt and transgenic animals at ~ 3 mo. (n=5). (F) Western blotting analysis of p27 and HP1γ protein levels in the VPs of wt and transgenic animals. Lamin A/C was used as loading control. The relative ratios of p27:lamin and HP1-γ:lamin were shown by setting the corresponding wt values to 1.0.
Figure 6
Figure 6. Microarray analysis of gene expression in transgenic VPs
(A-B) Venn diagram presentations of commonly up- and down-regulated genes. Comparisons were made of those genes that showed ≥1.5 fold changes (1.5 FC) of either upregulation (left) or downregulation (right) in the three hybridization groups, i.e., fl26-y versus wt-y, svb9-y versus wt-y, and wt-o versus wt-y. (C) qPCR analysis of four randomly picked genes upregulated in microarray. Shown are relative mRNA levels and bars represent mean ± S.D of three independent measurements. (D) qPCR analysis showing epithelial-specific expression of genes analyzed in (C). Epithelial glands from respective genotypes (at 6 mo.) were microdissected by LCM and qPCR analysis was carried out using RNA isolated from epithelial glands. Shown are relative mRNA levels and bars represent mean ± S.D of 3-4 independent measurements. (E) Serial whole-mount paraffin sections of wt and transgenic VPs at 2.5 months were used in IHC analysis of 15-LOX2 (upper) and Rb1cc1 (lower). Representative images (100x) of multiple animals analyzed (n>5/group) are presented. (F) Serial whole-mount cryosections of wt and transgenic VPs at 6 mo. were used in immunofluorescence staining of 15-LOX2 (upper) and clusterin (middle). Lower panel shows a merge with DAPI. Representative images (200x) of multiple animals analyzed (n>3/group) are presented. Note that a more uniform expression of 15-LOX2 can be seen in svb9 animals in cryosections (upper panel in F) compared to in paraffin sections (upper panel in E).
Figure 7
Figure 7. Schematic depicting possible mechanisms of action of 15-LOX2 and 15-LOX2sv-b
15-LOX2 possesses AA and LA-metabolizing activity to produce 15(S)-HETE and 13(S)-HODE, respectively, and may also possess, to a much lesser extent (depicted by thinner arrows), AA/LA metabolism-independent functions, which together induce ~600 upregulated and ~100 downregulated genes (by ≥1.5 fold) in mouse VPs. These changes in gene expression result in two cellular outcomes, i.e., prominent hyperplasia (with increase in numbers of both luminal and basal cells) associated with enhanced proliferation caused by 13(S)-HODE and early induction of senescence induced by 15(S)- HETE, which may cancel each other out resulting in minor prostate enlargement. In contrast, 15-LOX2sv-b lacks AA and LA-metabolizing activities and only causes alterations of a total of ~80 genes, among which 16 upregulated and 19 downregulated genes are commonly shared with the fl26 VPs. 15-LOX2sv-b expression increases mainly luminal cells without early induction of cell senescence resulting in hyperplasia and pronounced prostate ‘hypertrophy’. Persistent presence of senescence in 15-LOX2 transgenic prostate and late induction of senescence in 15-LOX2sv-b transgenic prostate may both constitute the barrier to hyperplasia-to-tumor progression.

References

    1. Abate-Shen C, Shen MM. Molecular genetics of prostate cancer. Genes Dev. 2000;14:2410–34. - PubMed
    1. Allred DC, Harvey JM, Berardo M, Clark GM. Prognostic and predictive factors in breast cancer by immunohistochemical analysis. Mod Pathol. 1998;11:155–68. - PubMed
    1. Bhatia B, Jiang M, Suraneni M, Patrawala L, Badeaux M, Schneider-Broussard R, et al. Critical and distinct roles of p16 and telomerase in regulating the proliferative life span of normal human prostate epithelial progenitor cells. J Biol Chem. 2008;283:27957–72. - PMC - PubMed
    1. Bhatia B, Maldonado CJ, Tang S, Chandra D, Klein RD, Chopra D, et al. Subcellular localization and tumor-suppressive functions of 15-lipoxygenase 2 (15-LOX2) and its splice variants. J Biol Chem. 2003;278:25091–100. - PubMed
    1. Bhatia B, Tang S, Yang P, Doll A, Aumueller G, Newman RA, et al. Cell-autonomous induction of functional tumor suppressor 15-lipoxygenase 2 (15-LOX2) contributes to replicative senescence of human prostate progenitor cells. Oncogene. 2005;24:3583–95. - PubMed

Publication types

Substances